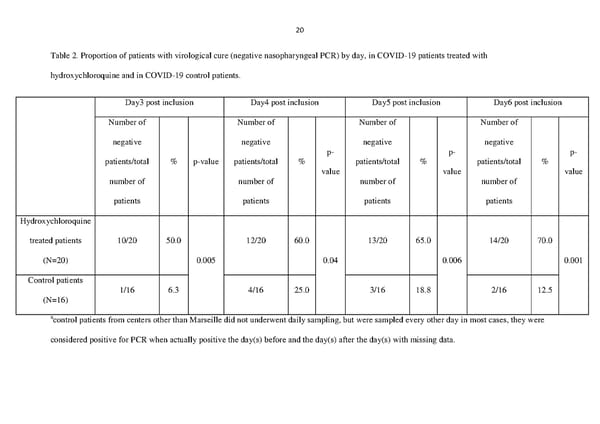
20 Table 2. Proportion of patients with virological cure (negative nasopharyngeal PCR) by day, in COVID-19 patients treated with hydroxychloroquine and in COVID-19 control patients. Day3 post inclusion Day4 post inclusion Day5 post inclusion Day6 post inclusion Number of Number of Number of Number of negative negative negative negative p- p- p- patients/total % p-value patients/total % patients/total % patients/total % value value value number of number of number of number of patients patients patients patients Hydroxychloroquine treated patients 10/20 50.0 12/20 60.0 13/20 65.0 14/20 70.0 (N=20) 0.005 0.04 0.006 0.001 Control patients 1/16 6.3 4/16 25.0 3/16 18.8 2/16 12.5 (N=16) acontrol patients from centers other than Marseille did not underwent daily sampling, but were sampled every other day in most cases, they were considered positive for PCR when actually positive the day(s) before and the day(s) after the day(s) with missing data.
 Hydroxychloroquine and Azithromycin as a Treatment of COVID-19 Page 19 Page 21