Jacobs Engineering Group ESG Disclosures
FY 2021 ESG Disclosures Boldly moving forward
FY21 ESG Disclosures July 2022 Unaudited 1 Introduction This document is intended to provide supplementary information to stakeholders of Jacobs Engineering Group Inc. (Jacobs or the Company) regarding our Environmental, Social and Governance (ESG) performance. In addition to the information herein, we strongly encourage review of additional company materials for a more comprehensive view of our ESG commitments and performance, including but not limited to our: Investor Relations ESG microsite FY2022-2024 Company Strategy Presentation PlanBeyond 2.0 TM Sustainability Strategy Climate Action Plan (2022) Climate Risk Assessment FY21 Climate Risk Assessment FY22 2021 CDP Submission Approved Science-Based Targets 2021 Integrated Annual Report FY21 10-K Report 2022 Proxy Statement This document is an annual update to our reporting and reflects activity through fiscal year 2021 (FY21). We may provide periodic updates as stakeholder ESG data requirements change. Document History and Status Revision Date Description 1 March 3, 2022 Initial release 2 July 12, 2022 Broad update to reflect additional data and developments since initial release
FY21 ESG Disclosures July 2022 Unaudited 2 Contents Introduction ........................................................................................................................................................................ 1 GENERAL .............................................................................................................................................................................. 5 GEN.1 Jacobs ESG Reporting .......................................................................................................................................... 5 GEN.2 Assurances and Verification ............................................................................................................................... 5 GEN.3 General Information.............................................................................................................................................. 6 GEN.4 Services and Markets ............................................................................................................................................ 6 GEN.5 External Engagement ........................................................................................................................................... 6 ENVIRONMENTAL .............................................................................................................................................................. 7 ENV.1 Introduction.............................................................................................................................................................. 7 ENV.2 Environmental Reporting.................................................................................................................................... 7 ENV.3 Greenhouse Gas Emissions ................................................................................................................................ 7 ENV.4 Greenhouse Gas Emissions - Scope 1 (Direct) ........................................................................................ 10 ENV.5 Greenhouse Gas Emissions - Scope 2 (Indirect) ..................................................................................... 10 ENV.6 Greenhouse Gas Emissions - Scope 3 (Indirect) ..................................................................................... 12 ENV.7 GHG Emissions Intensity Metrics .................................................................................................................. 14 ENV.8 Renewable Electricity and Carbon Offsets ................................................................................................ 14 ENV.9 Energy Consumption and Energy Intensity Metrics .............................................................................. 15 ENV.10 Water Consumption ........................................................................................................................................... 16 ENV.11 Biodiversity and Natural Capital .................................................................................................................... 16 ENV.12 Waste ....................................................................................................................................................................... 17 ENV.13 Hazardous Waste ................................................................................................................................................. 18 ENV.14 Environmental Management System (EMS) ............................................................................................ 18 ENV.15 Climate Change ................................................................................................................................................... 18 ENV.16 Carbon Pricing ...................................................................................................................................................... 20 ENV.17 Low-Carbon Transition Plan, Products and Services............................................................................. 21 ENV.18 Environmental Impact in Project Design and Delivery......................................................................... 25 SOCIAL ...............................................................................................................................................................................27 SOC.1 Introduction........................................................................................................................................................... 27 SOC.2 Employee Engagement .................................................................................................................................... 27 SOC.3 Inclusion and Diversity – Strategy ................................................................................................................ 28 SOC.4 Inclusion and Diversity – Workforce Metrics ............................................................................................ 30 SOC.5 Pay Equity and Pay Gap .................................................................................................................................... 32 SOC.6 Collective Bargaining ......................................................................................................................................... 33 SOC.7 Employee Wellbeing and Support Programs ........................................................................................... 33
FY21 ESG Disclosures July 2022 Unaudited 3 SOC.8 Hiring and Retention ......................................................................................................................................... 35 SOC.9 Training and Development ............................................................................................................................. 35 SOC.10 Human Rights ....................................................................................................................................................... 36 SOC.11 Community Investment .................................................................................................................................... 38 SOC.12 Health, Safety and Environment – Management ................................................................................... 40 SOC.13 HSE – Products and Services .......................................................................................................................... 48 SOC.14 Health and Safety – Metrics ............................................................................................................................ 49 SOC.15 Client Satisfaction ............................................................................................................................................... 50 GOVERNANCE ...................................................................................................................................................................52 GOV.1 Values, Ethics and Code of Conduct ............................................................................................................ 52 GOV.2 Supply Chain ......................................................................................................................................................... 53 GOV.3 Board Structure .................................................................................................................................................... 53 GOV.4 Board Composition and Diversity ................................................................................................................. 54 GOV.5 Board Nominations and Conflict of Interest ............................................................................................. 54 GOV.6 Board Roles and Effectiveness ....................................................................................................................... 55 GOV.7 Remuneration ....................................................................................................................................................... 55 GOV.8 Management Incentives (Non-Financial Metrics) .................................................................................. 56 GOV.9 Materiality Assessment and Sustainability Strategy ............................................................................. 56 GOV.10 ESG Governance .................................................................................................................................................. 62 GOV.11 Risk Governance .................................................................................................................................................. 63 GOV.12 Corruption .............................................................................................................................................................. 65 GOV.13 Cybersecurity and Data Privacy ..................................................................................................................... 65 SUSTAINABILITY ACCOUNTING STANDARDS BOARD (SASB) .............................................................................67 SASB.1 Professional and Commercial Services (PRO) ......................................................................................... 67 SASB.2 Engineering and Construction Services (E&C) ......................................................................................... 68 Tables 1 Science-based Target Progress ....................................................................................................................................... 8 2 DGHG Scope 1 Emissions ............................................................................................................................................... 10 3 GHG Scope 2 Emissions .................................................................................................................................................. 11 4 Renewable Energy by Region........................................................................................................................................ 11 5 Scope 3 Indirect GHG Emissions Estimates ............................................................................................................. 12 6 GHG Intensity Metrics ...................................................................................................................................................... 14 7 Annual Renewable Electricity and Carbon Offset Purchases ............................................................................ 14 8 Energy Consumption ........................................................................................................................................................ 15 9 Energy Intensity .................................................................................................................................................................. 15
FY21 ESG Disclosures July 2022 Unaudited 4 10 Water Consumption .......................................................................................................................................................... 16 11 Waste Disposed .................................................................................................................................................................. 17 12 Hazardous Waste Generation ........................................................................................................................................ 18 13 Employee Engagement ................................................................................................................................................... 28 14 Workforce Composition by Geography ..................................................................................................................... 30 15 Gender Diversity by Management Level (Global) ................................................................................................. 30 16 Gender Diversity by Management Level and Job Type (Global) .................................................................... 31 17 Racial/Ethnic Diversity (US Only) ................................................................................................................................ 31 18 Racial/Ethnic Diversity by Management Level (US Only) .................................................................................. 31 19 Diversity by Age Group (Global) .................................................................................................................................. 31 20 Average Employee Age by Gender (Global) ........................................................................................................... 32 21 Distribution of Gender by Age Group (Global) ...................................................................................................... 32 22 Employee Turnover (Global) ......................................................................................................................................... 35 23 Hiring (Global) .................................................................................................................................................................... 35 24 Training and Development Metrics ............................................................................................................................ 36 25 Contributions Via Collectively Platform .................................................................................................................... 39 26 Contributions Summary by Type of Contribution ................................................................................................. 39 27 Fatalities ................................................................................................................................................................................ 49 28 Total Recordable Incident Rates .................................................................................................................................. 49 29 Contractor Total Recordable Incident Rates ........................................................................................................... 49 30 Lost-time Injury Frequency Rate ................................................................................................................................. 49 31 Contractor Lost-time Injury Frequency Rate ........................................................................................................... 50 32 Occupational Illness Frequency Rate ......................................................................................................................... 50 33 Absentee Rate (Non-US Only) ...................................................................................................................................... 50 34 Client Satisfaction Rate ................................................................................................................................................... 51 35 Compensation ..................................................................................................................................................................... 55 36 Jacobs’ Core SDGs, Material Topics, Strategy and Performance .................................................................... 59 37 Emerging Risks ................................................................................................................................................................... 64 38 Sustainability Disclosure Topics and Accounting Metrics (PRO) .................................................................... 67 39 Activity Metrics (PRO) ...................................................................................................................................................... 68 40 Sustainability Disclosure Topics and Accounting Metrics (E&C) ..................................................................... 68 Figures 1 Renewable Electricity by Region (MWh) ...................................................................................................................... 8 2 2022 Materiality Assessment: Priority Issues ......................................................................................................... 57 3 PlanBeyond 2.0 Sustainable Business Objectives ................................................................................................. 58 4 ESG Governance Structure ............................................................................................................................................. 62
FY21 ESG Disclosures July 2022 Unaudited 5 GENERAL GEN.1 Jacobs ESG Reporting Jacobs has reported on a wide range of Environmental, Social and Governance (ESG) issues through our annual ESG Disclosures since 2019. We have also reported on ESG issues via our Integrated Annual Report, Form 10-K, Proxy Statement, and other public materials. This report is focused on our priority ESG data that we believe is the most relevant to our business and important to our stakeholders. This report is aligned to the Sustainability Accounting Standards Board ( SASB ) framework and informed by Global Reporting Initiative ( GRI ) standards. Annually, we disclose to CDP (formerly the Carbon Disclosure Project) and the S&P Global Corporate Sustainability Assessment, ( CSA ), which is the basis for the S&P Global ESG Score and a key factor for inclusion in the Dow Jones Sustainability Indices . We disclose our climate risk data in line with the Task Force on Climate-related Financial Disclosures ( TCFD ) recommendations. We also regularly engage with leading ESG rating and ranking organizations to review and improve the accuracy of their data regarding our ESG performance. We understand and champion the increasing appetite for ESG metrics and transparency. We take a pragmatic approach to our disclosures, focusing on what is material, what is a risk or opportunity, and what makes sense for our business. We look forward to a consistent, industry-wide reporting framework that serves the investor community and reduces reliance on lagging indicators—allowing companies to be more efficient and focused on improving ESG performance. This document covers activities in fiscal year 2021 (FY21) for Jacobs from October 3, 2020, to October 1, 2021. Our FY20 report was released in January of 2021 and was last updated in July 2021. Jacobs meets current Securities and Exchange Commission (SEC) climate change related disclosure obligations in our Annual Report on Form 10-K. Jacobs will release an ESG disclosure document annually and will make periodic updates as required by new SEC rules and regulations and as additional information is obtained or to fulfill stakeholder requests for disclosures. We apply an operational control approach as the boundary for our ESG reporting. On March 3, 2021, Jacobs acquired a 65% stake in PA Consulting. In alignment with the greenhouse gas (GHG) Protocol, our investment in PA Consulting is included within our scope 3 GHG emissions data for FY21, which includes GHG emissions outside of our operational control. PA Consulting is otherwise excluded from our ESG reporting in this document. For more information on our approach to integrating PA Consulting into our GHG emissions inventory, see section ENV.6 GHG Emissions - Scope 3 (Indirect) . We also acquired BlackLynx, Inc. in November 2021 and Street Light Data, Inc. in February 2022. These acquisitions are not included in this report because they were consummated in FY22. Additionally, ESG and GHG data from our Joint Ventures are not within the reporting boundary of this report. For questions regarding this document, please contact: [email protected] . GEN.2 Assurances and Verification This document has gone through internal review by subject matter experts, legal experts and internal auditors to confirm accuracy of the contents as of the time of publication, but only our GHG emissions data reported here was externally verified, with limited assurance. In the future, we intend to obtain independent assurance of additional data, including social indicators. This document and the data within should be considered unaudited. Certain information reported herein contains estimates or is based on assumptions. Furthermore, forward-looking information in the report, including our goals, plans and expectations, involve risks and uncertainties that may result in our not achieving goals or cause actual results to differ materially from those expressed or implied. Our FY21 Form 10-K (pp. 21–46) contains a discussion of some of the risks and uncertainties that could cause our actual results to differ from our plans and expectations.
FY21 ESG Disclosures July 2022 Unaudited 6 Our FY21 GHG emissions were externally verified by a third party, Cameron-Cole, LLC. on February 24, 2022. Our limited assurance verification statements are published on the Jacobs Investor Relations ESG microsite, including both our FY19-20 and FY21 verification statements. GEN.3 General Information Jacobs Engineering Group Inc. is a publicly held corporation, incorporated in the State of Delaware. Jacobs shares trade on the New York Stock Exchange (Ticker: J). Jacobs is headquartered in Dallas, Texas (TX): 1999 Bryan Street, Suite 1200, Dallas, TX 75201 Exhibit 21 to our FY21 Form10-K contains a list of all of Jacobs’ material subsidiaries. GEN.4 Services and Markets Jacobs provides services in two lines of business (LOB): Critical Mission Solutions (CMS) and People & Places Solutions (P&PS), and holds a majority investment in PA Consulting, which are also the Company’s financial reportable segments. As stated in GEN.1 Jacobs ESG Reporting , our investment in PA Consulting is included within our scope 3 GHG emissions for FY21, but PA Consulting is otherwise excluded from our ESG reporting in this document. Detailed descriptions of the LOBs can be found in our FY21 Form 10-K (pp. 11–15). Jacobs’ operations are located primarily in North America, Europe, Middle East and Asia Pacific, with detailed locations available on Jacobs.com . For FY21, Jacobs had revenues of $14.1 billion and approximately 55,000 people worldwide, including a contingent workforce of approximately 3,000 people. Excluding PA Consulting, Jacobs had FY21 revenues of $13.5 billion. Detailed financial information is included in our FY21 Form 10-K . GEN.5 External Engagement Jacobs is involved in various external organizations and initiatives dedicated to advancing our ESG and sustainability priorities, including but not limited to: United Nations (U.N.) Global Compact – Participant level U.N. Race to Zero Campaign Supporter U.N. Global Compact Chief Financial Officer (CFO) Coalition for the Sustainable Development Goals (SDGs) – Founding Member World Economic Forum (WEF) Infrastructure and Urban Development Governors Committee WEF Alliance of Chief Executive Officer (CEO) Climate Leaders Science Based Targets Initiative (SBTi) – Business Ambition for 1.5°C SBTi Technical Advisory Group (TAG) U.S. Environmental Protection Agency (EPA) Green Power Partnership Business in the Community United Kingdom (U.K.) Net Zero Taskforce World Environment Center BSR (Businesses for Social Responsibility) Environmental Analyst – Sustainable Delivery Group Task Force on Climate-Related Financial Disclosures (TCFD) Supporter CDP Supply Chain Member Pledge to Net Zero Alliance Catalyst CEO Champions for Change
FY21 ESG Disclosures July 2022 Unaudited 7 ENVIRONMENTAL ENV.1 Introduction As a recognized global leader in environmental and sustainability professional services, Jacobs holds environmental protection as a core value, as expressed in the Jacobs Global Environmental Management Commitment Statement and as the cornerstone of our PlanBeyond ℠ Sustainability and BeyondZero ℠ Health, Safety and Environment (HSE) approaches. Our Office of Global Climate Response & ESG was established in October 2021 and reports to our President and Chief Operations Officer (COO), Bob Pragada. The office acts as a connecting point for Jacobs’ go-to-market solutions within the framework of energy transition, decarbonization, adaptation and resilience, and natural resource stewardship, along with ESG advisory. Globally, in FY20 and FY21 we achieved 100% renewable electricity for our operations and carbon neutrality for our operations and business travel, as further described under ENV.3 Greenhouse Gas Emissions . We are committed to continuing these achievements. ENV.2 Environmental Reporting We report on environmental issues and Key Performance Indicators (KPIs) in the public domain and provide targets linked to these indicators. All environmental indicators reported in this document, unless otherwise noted, cover 100% of Jacobs’ business locations. Carbon emissions were third-party verified with limited assurance for all years reported. Other relevant information is available in our Integrated Annual Report, PlanBeyond 2.0 sustainable business approach, and Environmental Performance Reports for locations certified to ISO14001. ENV.3 Greenhouse Gas Emissions Our deep commitment to environmental protection and concern regarding the climate crisis led to aggressive carbon emission commitments that are set forth in our Climate Action Plan , first published on April 22, 2020. Detailed in our Carbon Neutrality Commitment included in the Climate Action Plan, we achieved 100% low-carbon electricity and became carbon neutral for our operations and business travel in 2020 and continue to maintain these commitments. Joining over 300 companies worldwide in November 2020, Jacobs became a signatory to the U.N. Business Ambition for 1.5°C , an urgent request for action from the global coalition of U.N. agencies, business and industry leaders, calling on businesses to set ambitious science-based emissions reduction targets aligned with limiting global temperature rise to 1.5°C above pre-industrial levels. Our 2020 climate commitments were a major milestone in our drive to address the climate crisis. In keeping with our core value of “We Aim Higher” and the continually evolving guidance and best practices for climate response, we revised our plan and targets. In our updated Climate Action Plan , published in April 2022, we commit to the following: 1. Ensure every project becomes a climate response opportunity. 2. Achieve net-zero greenhouse gas emissions across the value chain by 2040. 3. Maintain carbon neutrality status and 100% low-carbon electricity for our operations. As a member of the Science Based Target initiative (SBTi) Technical Advisory Group (TAG) since 2020 and a participant in the Net-Zero Road Test in 2021, we committed to setting net-zero targets in line with the SBTi Corporate Net-Zero Standard. Key requirements of the Net-Zero Standard include focusing on rapid, deep emissions cuts; setting near- and long-term targets; claiming achievement of net zero only after long-term targets are met; and investing in mitigation within and outside the value chain.
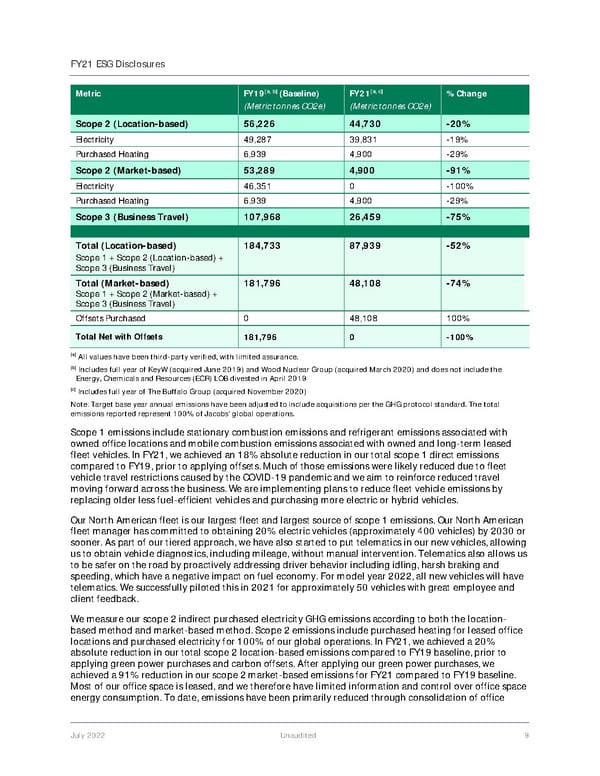
FY21 ESG Disclosures July 2022 Unaudited 8 We have approved near- and long-term science-based emissions reduction targets with the SBTi. This means our emissions reduction targets are consistent with the aim of the Paris Agreement to limit average global warming to 1.5°C by the end of the century, compared to pre-industrial temperatures. They are also consistent with the Net-Zero Standard. Our near-term targets are approved by the SBTi as follows: We commit to reduce absolute scope 1 and 2 GHG emissions 50% by 2030 from a 2019 base year and we commit to reduce absolute scope 3 GHG emissions from business travel and employee commuting by 50% over the same timeframe. We commit that 65% of our suppliers by spend covering purchased goods and services will have science-based targets by 2025. Our long-term targets are approved by the SBTi as follows: We commit to reduce absolute scopes 1, 2 & 3 GHG emissions 90% by 2040 from a 2019 base year. In January 2021, we made a three-year commitment to CDP – an international non-profit organization that runs a global disclosure system focused on environmental impact – as a supply chain member to engage our suppliers, pinpoint risks and identify opportunities to support our suppliers in reducing emissions and strengthening their climate resiliency. Jacobs was recognized on CDP’s 2021 Supplier Engagement Leaderboard for engaging our suppliers on climate change and playing a crucial role in the transition towards the net-zero sustainable economy. We continue to be a member of the U.S. EPA Green Power Partnership, a voluntary program that supports the development of new renewable generation capacity in the U.S. and requires annual use of green power at a level that meets or exceeds partnership benchmark requirements. Thanks to our industry-leading commitments and achievement, we are now proud to be one of the Top Partner Rankings as a U.S. EPA Green Power Partnership 100% Green Power User . We use the GHG Protocol Corporate Accounting and Reporting standard to calculate emissions using Intergovernmental Panel on Climate Change (IPCC) Fifth Assessment Report emission factors. All GHGs, including CO2, CH4, N20, HFCs, PFCs, SF6 and NF3, are included in calculations of metric tonnes of carbon dioxide equivalents (C02e). We use an operational control approach as the boundary for consolidation of emissions. We are using 2019 as our baseline year for all carbon reporting and carbon reduction target- setting, and we are committed to publishing our GHG inventory (carbon footprint), which is verified by an accredited third party each year with limited assurance. In FY19, we completed the acquisition of KeyW. In FY20, we completed the acquisition of John Wood Group’s nuclear business, Wood Nuclear Group. FY19 base year values have been updated to reflect these acquisitions, as well as improvements to data collection and a better understanding of boundaries. In FY21, we completed the acquisition of Buffalo Group. The emissions from The Buffalo Group have been added to the FY21 inventory but have not been added to the FY19 baseline values because they are not materially significant, comprising less than 1% of our total FY21 inventory. Table 1 summarizes our commitment to carbon neutrality for our operations and business travel and reflects progress against our science-based targets prior to and after the application of renewable electricity and carbon offsets: Table 1. Science-based Target Progress Metric FY19 [a, b] (Baseline) (Metric tonnes CO2e) FY21 [a, c] (Metric tonnes CO2e) % Change Scope 1 20,539 16,749 -18% Mobile Combustion 20,033 16,312 -19% Stationary Combustion 506 393 -22% HFC Fugitive Emissions Not Reported 44 n/a
FY21 ESG Disclosures July 2022 Unaudited 9 Metric FY19 [a, b] (Baseline) (Metric tonnes CO2e) FY21 [a, c] (Metric tonnes CO2e) % Change Scope 2 (Location-based) 56,226 44,730 -20% Electricity 49,287 39,831 -19% Purchased Heating 6,939 4,900 -29% Scope 2 (Market-based) 53,289 4,900 -91% Electricity 46,351 0 -100% Purchased Heating 6,939 4,900 -29% Scope 3 (Business Travel) 107,968 26,459 -75% Total (Location-based) Scope 1 + Scope 2 (Location-based) + Scope 3 (Business Travel) 184,733 87,939 -52% Total (Market-based) Scope 1 + Scope 2 (Market-based) + Scope 3 (Business Travel) 181,796 48,108 -74% Offsets Purchased 0 48,108 100% Total Net with Offsets 181,796 0 -100% [a] All values have been third-party verified, with limited assurance. [b] Includes full year of KeyW (acquired June 2019) and Wood Nuclear Group (acquired March 2020) and does not include the Energy, Chemicals and Resources (ECR) LOB divested in April 2019 [c] Includes full year of The Buffalo Group (acquired November 2020) Note: Target base year annual emissions have been adjusted to include acquisitions per the GHG protocol standard. The total emissions reported represent 100% of Jacobs' global operations. Scope 1 emissions include stationary combustion emissions and refrigerant emissions associated with owned office locations and mobile combustion emissions associated with owned and long-term leased fleet vehicles. In FY21, we achieved an 18% absolute reduction in our total scope 1 direct emissions compared to FY19, prior to applying offsets. Much of those emissions were likely reduced due to fleet vehicle travel restrictions caused by the COVID-19 pandemic and we aim to reinforce reduced travel moving forward across the business. We are implementing plans to reduce fleet vehicle emissions by replacing older less fuel-efficient vehicles and purchasing more electric or hybrid vehicles. Our North American fleet is our largest fleet and largest source of scope 1 emissions. Our North American fleet manager has committed to obtaining 20% electric vehicles (approximately 400 vehicles) by 2030 or sooner. As part of our tiered approach, we have also started to put telematics in our new vehicles, allowing us to obtain vehicle diagnostics, including mileage, without manual intervention. Telematics also allows us to be safer on the road by proactively addressing driver behavior including idling, harsh braking and speeding, which have a negative impact on fuel economy. For model year 2022, all new vehicles will have telematics. We successfully piloted this in 2021 for approximately 50 vehicles with great employee and client feedback. We measure our scope 2 indirect purchased electricity GHG emissions according to both the location- based method and market-based method. Scope 2 emissions include purchased heating for leased office locations and purchased electricity for 100% of our global operations. In FY21, we achieved a 20% absolute reduction in our total scope 2 location-based emissions compared to FY19 baseline, prior to applying green power purchases and carbon offsets. After applying our green power purchases, we achieved a 91% reduction in our scope 2 market-based emissions for FY21 compared to FY19 baseline. Most of our office space is leased, and we therefore have limited information and control over office space energy consumption. To date, emissions have been primarily reduced through consolidation of office
FY21 ESG Disclosures July 2022 Unaudited 10 space. We are implementing plans to further reduce office emissions by continuing to reduce office space, leasing more energy efficient office space and working with our lessors on implementing more energy efficiency measures and obtaining more accurate utility consumption data to capture those impacts. The COVID-19 pandemic greatly impacted our FY20 and FY21 business travel emissions. Business travel is our largest source of carbon emissions and, as expected, we saw a 75% reduction in our scope 3 business travel emissions from FY19 to FY21, mainly due to COVID-19 restrictions on both domestic and international travel. Our goal moving forward is to prevent rebound of these emissions back to pre- COVID-19 levels. As we move to a new post-COVID-19 norm, we are committed to manage business travel and employee commuting emissions in accordance with our science-based target reduction of 50% from 2019 levels by 2030. Our verification statements are published on the Jacobs Investor Relations ESG microsite, including both our FY19-20 and FY21 verification statements. The emission estimates provided in the following sections reflect our annual emissions associated with our revenue for each reporting year and therefore do not reflect the acquisitions until they occurred. This methodology differs from the FY19 estimates provided in this section which have been re-baselined according to the GHG protocol criteria which require adjusting the target base year to account for significant impacts associated with acquisitions, divestitures, changes in methodology, or other events necessary to provide relevant comparisons over time. ENV.4 Greenhouse Gas Emissions - Scope 1 (Direct) Our total direct GHG emissions (DGHG) scope 1 are summarized in Table 2. We purchased carbon offsets to offset 100% of our scope 1 emissions in FY20 and FY21. After applying carbon offsets, our FY20 and FY21 net scope 1 emissions are zero metric tonnes of carbon dioxide equivalents. Table 2. DGHG Scope 1 Emissions Metric Unit FY19 [a, b] FY20 [a, c] FY21 [a, d] Total direct GHG emissions Metric tonnes CO 2 e 19,345 17,646 16,749 Data coverage Percentage of global operations 100% 100% 100% [a] All values have been third-party verified, with limited assurance. [b] Includes 4 months KeyW (acquired June 2019) and does not include ECR LOB (divested April 2019) [c] Includes 7 months Wood Nuclear Group (acquired March 2020) [d] Includes The Buffalo Group (acquired November 2020); The Buffalo Group did not have any scope 1 sources in FY21. Scope 1 emissions include stationary combustion emissions and refrigerant emissions associated with owned office locations and mobile combustion emissions associated with owned and long-term leased fleet vehicles for 100% of Jacobs' global operations. Scope 1 emissions are estimated based on fuel consumption and/or vehicle mileage and published emission factors. Our limited assurance verification statements are published on the Jacobs Investor Relations ESG microsite, including both our FY19-20 and FY21 verification statements. ENV.5 Greenhouse Gas Emissions - Scope 2 (Indirect) Our location-based and market-based indirect GHG emissions from electricity purchased (purchased and consumed, for example, without energy trading) (IGHG scope 2) are summarized in Table 3. We purchased renewable energy to cover 100% of our electricity consumption in FY20 and FY21. We purchased carbon offsets to cover 100% of our purchased heating scope 2 emissions in FY20 and FY21. After applying these green power purchases for electricity and carbon offsets for purchased heating, our FY20 and FY21 net scope 2 emissions are zero tonnes CO 2 e.
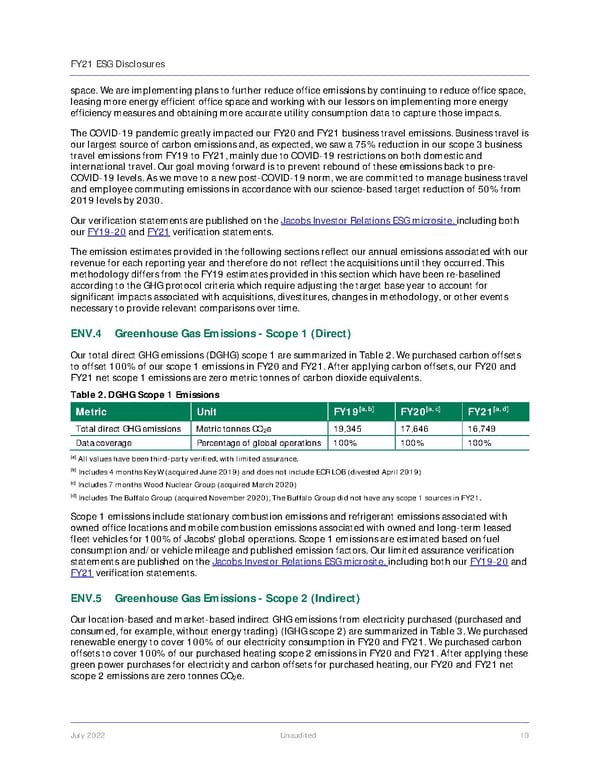
FY21 ESG Disclosures July 2022 Unaudited 11 Table 3. IGHG Scope 2 Emissions Metric Unit FY19 [a, b] FY20 [a, c] FY21 [a, d] Total indirect GHG emissions (Location-based) Metric tonnes CO 2 e 53,275 52,984 44,730 Electricity Metric tonnes CO 2 e 46,912 46,301 39,831 Purchased Heating Metric tonnes CO 2 e 6,363 6,683 4,900 Total indirect GHG emissions (Market- Based) Metric tonnes CO 2 e 43,581 6,683 4,900 Data coverage Percentage of global operations 100% 100% 100% [a] All values have been third-party verified, with limited assurance. [b] Includes 4 months KeyW (acquired June 2019) & does not include ECR Line of Business (divested April 2019) [c] Includes 7 months Wood Nuclear Group (acquired March 2020) [d] Includes Buffalo Group (acquired November 2020) We measure our scope 2 indirect purchased electricity GHG emissions according to both the location-based method and market-based method. Scope 2 emissions include comfort heating for leased office locations and purchased electricity for 100% of our global operations. Our commitment to 100% low carbon electricity means that our electricity needs are expected to be supplied through a variety of sources globally such as green tariffs, renewable energy certificates (RECs), energy attribute certificates (EACs) and virtual purchase power agreements (VPPAs). We are a partner in the U.S. EPA’s Green Power Partnership , a voluntary program, where the goal is to increase the use of green power among organizations in the U.S. as a way to reduce the environmental impacts associated with conventional electricity use. In the U.K., we purchase 100% renewable electricity through Renewable Energy Guarantees Origin (REGO) certificates for all offices where we are directly responsible for procuring energy. This accounts for over half of our U.K. offices. In FY21, we began purchasing 100% renewable electricity through our utility energy providers in Australia and New Zealand for offices where we are directly responsible for procuring energy and where certified renewable energy was available. We purchased the remainder of our FY20 and FY21 global renewable electricity through third-party providers of RECs or EACs to cover 100% of our electricity consumption globally. FY21 renewable electricity purchases were sourced according to where our electricity consumption occurs globally, as shown by megawatt hour (MWh) in Table 4 and Figure 1. Table 4. Renewable Energy by Region We do not have access to actual energy consumption associated with the majority of our 350+ leased locations. We estimate energy consumption for most of our leased locations by using Commercial Buildings Energy Consumption Survey (CBECS) data published by the U.S. Energy Information Administration. CBECS provides average energy intensity use for various types of buildings in various climate zones. This data, combined with the office size, is used to estimate energy consumption and is subsequently combined with published energy emission factors to estimate associated energy emissions for each office location. Including this data in our carbon inventory helps us develop strategies to better Region MWh of Renewable Electricity Asia-Pacific 9,053 Europe 19,662 North America 70,400 Middle East and Africa 1,093 Total 100,208 Asia-Pacific 9% Europe 20% ME&A 1% North America 70% Figure 1. Renewable Electricity by Region (MWh)
FY21 ESG Disclosures July 2022 Unaudited 12 understand and manage energy consumption and emissions in our leased offices. For example, we have used this data to identify our locations with the greatest energy consumption and carbon emissions for which we have begun or will start collecting utility invoice data or installing submeters, where feasible, to better understand our ability to facilitate improvements in energy efficiency. Our limited assurance verification statements are published on the Jacobs Investor Relations ESG microsite, including both our FY19-20 and FY21 verification statements. ENV.6 Greenhouse Gas Emissions - Scope 3 (Indirect) We completed a scope 3 screening evaluation in 2020 using FY19 data to identify scope 3 sources that are material to Jacobs and assess where we can make impactful changes. Based on screening level estimates for employee commuting and purchased goods and services and our calculated emissions for business travel, our four largest scope 3 sources include business travel, employee commuting, purchased goods and services and upstream fuel and energy-related activities not already included in scope 1 and scope 2. On March 3, 2021, we acquired a 65% stake in PA Consulting. PA Consulting was therefore not included in our scope 3 sources when this assessment was initially completed based on FY19 data. However, in alignment with the GHG Protocol, our investment in PA Consulting is included within our scope 3 GHG emissions data for FY21. Once PA Consulting emissions are finalized and verified, we expect to update our FY19 baseline to include PA Consulting and track progress against our SBTi net-zero target. During the SBTi net-zero targets approval process, we added emissions associated with upstream fuel to our scope 3 business travel and employee commuting, known as well-to-tank (WTT) emissions, to reflect changes in the SBTi Net-Zero standard which differs from the GHG Protocol scope 3 standard. Our scope 3 indirect GHG emission estimates from business travel, business travel WTT, employee commuting, employee commuting WTT, fuel and energy-related activities, purchased goods and services and investments are summarized in Table 5. Our final limited assurance verification statements are published to the Jacobs Investor Relations ESG microsite, including both our FY19-20 and FY21 verification statements. Table 5. Scope 3 Indirect GHG Emissions Estimates Metric Unit FY19 [a] (estimated) FY20 [b] (estimated) FY21 [c] (estimated) Business Travel [d] Metric tonnes CO2e 105,245 53,533 26,459 Business Travel WTT [e] Metric tonnes CO2e 14,043 7,122 4,174 Employee Commuting [d] Metric tonnes CO2e 78,247 46,434 21,351 Employee Commuting WTT [e] Metric tonnes CO2e 15,583 9,238 4,232 Purchased Goods and Services [f] Metric tonnes CO2e 25,823 25,823 25,823 Upstream Fuel and Energy Related Activities for scope 1 and scope 2 [g] Metric tonnes CO2e 15,793 4,412 4,187 Investments [h] Metric tonnes CO2e N/A N/A 2,017 Data coverage Percentage of global operations 100% 100% 100% [a] Includes 4 months KeyW (acquired June 2019) and does not include ECR Line of Business (divested April 2019) [b] Includes 7 months Wood Nuclear Group (acquired March 2020) [c] Includes The Buffalo Group (acquired November 2020) [d] Jacobs has externally verified business travel for FY19, FY20, and FY21, and employee commuting for FY19 and FY21, with limited assurance. [e] Jacobs has externally verified WTT emissions for both business travel and employee commuting for FY19 and FY21, with limited assurance.
FY21 ESG Disclosures July 2022 Unaudited 13 [f] Emissions associated with purchased goods and services are estimated using annual spend combined with emissions factors from the CEDA6 database, which provides industry average emissions factors for economic product and service categories. As of the date of this document’s publication, third party validation of these estimates is in process. [g] Estimates for upstream fuel and energy-related activities were completed using U.K. Department of Environment, Food & Rural Affairs (DEFRA) guidance and emission factors. As of the date of this document’s publication, third party validation of these estimates is in process. [h] Based on 65% ownership in PA Consulting acquired on March 3, 2021. Data represents 65% of the PA Consulting emissions reported in 2021, not including its purchased goods and services that are undergoing review. The COVID-19 pandemic greatly impacted our FY20 and FY21 business travel and employee commuting emissions. Business travel is our largest source of carbon emissions, and as expected, we saw a 75% reduction in our scope 3 business travel emissions from FY19 to FY21, mainly due to COVID-19 restrictions on both domestic and international travel. Our goal moving forward is to prevent a rebound of these emissions back to pre-COVID levels. As we move to a new post-COVID norm we are committed to manage business travel and employee commuting emissions in accordance with our science-based target reduction of 50% from 2019 levels by 2030. Efforts to reduce our business travel carbon emissions were previously underway prior to the COVID-19 pandemic. For example, we created an employee dashboard so our people can view their travel carbon footprint and be empowered individually to help us meet our global emissions reduction goals by reducing their own travel and using less carbon-intensive meeting methods. Business Units are accountable for tracking, monitoring and reporting business travel in alignment with this new reporting tool. As announced on December 13, 2021, effective January 1, 2022, we established an internal carbon price of $50 per ton for all non-billable business travel to influence sustainable decision-making around travel reduction and further help reduce our carbon footprint. The carbon cost calculated for every non-billable business trip will be added to the overall cost of travel and charged to the applicable business unit. Proceeds will be used to fund carbon reduction and removal initiatives. Employee commuting estimates are based on Jacobs’ Human Resources data, including employee numbers, worker location, worker type and worker status. Commuting estimates account for duration and frequency of employees working from home due to COVID-19 based on generalized office count information. Employee commuting numbers include all company acquisitions to the end of the fiscal year. Estimates account for employee commuting mode (for example, passenger car, truck or bus) and round-trip travel distances. Both are estimated using average data sources, as recommended by the GHG Protocol Technical Guidance for Calculating scope 3 Emissions, since no employee commuting surveys with this type of data were performed by us during FY19, FY20 or FY21. Employee commuting estimates are then multiplied by the appropriate emission factors to obtain total employee commuting emissions. Emission factors come from the U.S. EPA Center for Corporate Climate Leadership GHG Emission Factors Hub (April 2021) for U.S. data, the U.K. Government GHG Conversion Factors for Company Reporting (July 2020) for U.K. data, and the WRI GHG Emission Factors Compilation (March 2017) for all other countries’ data. We saw a 73% reduction in our scope 3 emissions for employee commuting from FY19 to FY21, mainly due to COVID-19 restrictions on our employees for commuting to our offices, requiring most of our employees to work from home. We are currently collecting survey data from our employees to account for actual commuting patterns and encourage continued reductions post-COVID. We anticipate our science-based targets for business travel and employee commuting will be met through the following: Increased use of video conferencing for internal and external business meetings Online versus in-person trainings Virtual professional and industry association conferences Reduced transportation vehicle emissions Alternative, cleaner transportation methods
FY21 ESG Disclosures July 2022 Unaudited 14 ENV.7 GHG Emissions Intensity Metrics The following table summarizes our GHG intensity metrics both prior to the application of renewable electricity and carbon offsets (location-based) and after the application of renewable energy (market- based). Table 6. GHG Intensity Metrics Revenue Intensity Office Area Intensity Metric Unit FY20 [a, b] FY21 [a, c] Metric Unit FY20 [a, b] FY21 [a, c] Location- based GHG [d] Metric tonnes CO 2 e 70,630 61,479 Location- based GHG [e] Metric tonnes CO 2 e 53,387 45,168 Market- based GHG [f] Metric tonnes CO 2 e 24,329 21,648 Market- based GHG [g] Metric tonnes CO 2 e s 7,086 5,337 Revenue Million USD 13,567 13,465 Office Area Thousand ft 2 7,590 7,337 Revenue Location- based GHG [d] Intensity Metric tonnes CO 2 e per million USD 5.21 4.57 Office Area Location- based GHG [e] Intensity Metric Tonnes CO 2 e per one thousand ft 2 7.03 6.16 Revenue Market- based GHG [f] Intensity Metric tonnes CO 2 e per million USD 1.79 1.61 Office Area Market- based GHG [g] Intensity Metric Tonnes CO 2 e per one thousand ft 2 0.93 0.73 Data Coverage Percentage of global operations 100% 100% Data Coverage Percentage of global operations 100% 100% [a] Emissions data has been third-party verified for all reported years, with limited assurance. [b] Includes 7 months Wood Nuclear Group (acquired March 2020) [c] Includes The Buffalo Group (acquired November 2020) [d] Metric for all scope 1 and scope 2 GHG Emissions before renewable energy (location-based) and carbon offsets [e] Metric for scope 1 and scope 2 GHG emissions associated with office space (for example, does not include mobile combustion sources) before renewable energy (location-based) and carbon offsets [f] Metric for all scope 1 and scope 2 GHG Emissions with renewable energy (market-based) and before carbon offsets [g] Metric for scope 1 and scope 2 GHG emissions associated with office space (for example does not include mobile combustion sources) with renewable energy (market-based) and before carbon offsets Notes: ft 2 = square feet;; USD = U.S. dollar ENV.8 Renewable Electricity and Carbon Offsets The following table summarizes our annual renewable electricity and carbon offset purchases. Table 7. Annual Renewable Electricity and Carbon Offset Purchases Metric Unit FY19 [a] FY20 [a] FY21 [a] Renewable Electricity [b] MWh 12,155 112,589 100,208 Carbon Offsets [c] Metric tonnes CO 2 e 0 77,862 48,108 Data coverage Percentage of global operations 100% 100% 100% [a] Emissions data has been third-party verified for all reported years, with limited assurance. [b] Starting in FY20, renewable electricity or renewable energy certificates were purchased to cover 100% of our electricity purchases [c] Starting in FY20, carbon offsets were purchased to cover 100% of our scope 1, scope 2 heating and scope 3 business travel carbon emissions
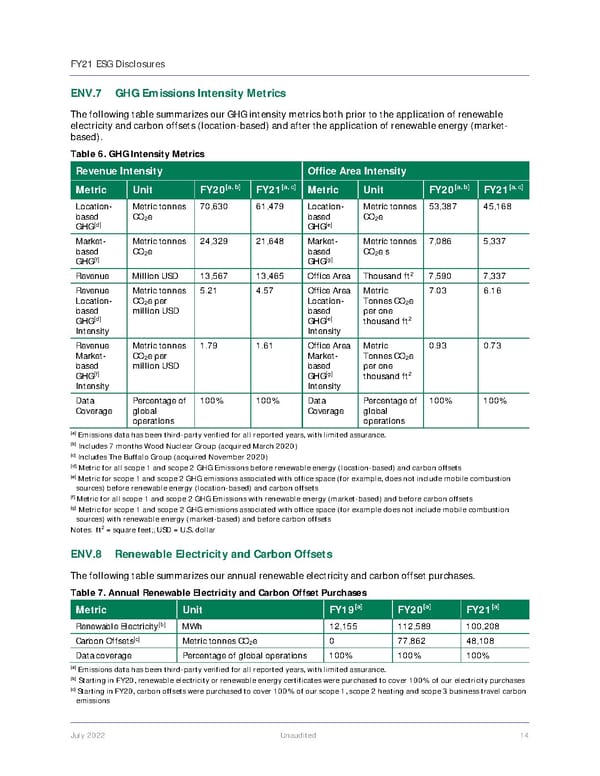
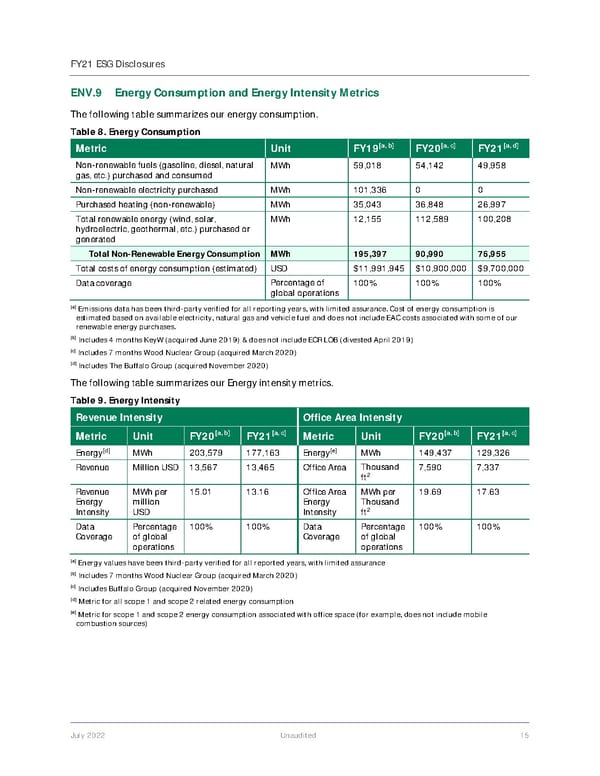
FY21 ESG Disclosures July 2022 Unaudited 15 ENV.9 Energy Consumption and Energy Intensity Metrics The following table summarizes our energy consumption. Table 8. Energy Consumption Metric Unit FY19 [a, b] FY20 [a, c] FY21 [a, d] Non-renewable fuels (gasoline, diesel, natural gas, etc.) purchased and consumed MWh 59,018 54,142 49,958 Non-renewable electricity purchased MWh 101,336 0 0 Purchased heating (non-renewable) MWh 35,043 36,848 26,997 Total renewable energy (wind, solar, hydroelectric, geothermal, etc.) purchased or generated MWh 12,155 112,589 100,208 Total Non-Renewable Energy Consumption MWh 195,397 90,990 76,955 Total costs of energy consumption (estimated) USD $11,991,945 $10,900,000 $9,700,000 Data coverage Percentage of global operations 100% 100% 100% [a] Emissions data has been third-party verified for all reporting years, with limited assurance. Cost of energy consumption is estimated based on available electricity, natural gas and vehicle fuel and does not include EAC costs associated with some of our renewable energy purchases. [b] Includes 4 months KeyW (acquired June 2019) & does not include ECR LOB (divested April 2019) [c] Includes 7 months Wood Nuclear Group (acquired March 2020) [d] Includes The Buffalo Group (acquired November 2020) The following table summarizes our Energy intensity metrics. Table 9. Energy Intensity Revenue Intensity Office Area Intensity Metric Unit FY20 [a, b] FY21 [a, c] Metric Unit FY20 [a, b] FY21 [a, c] Energy [d] MWh 203,579 177,163 Energy [e] MWh 149,437 129,326 Revenue Million USD 13,567 13,465 Office Area Thousand ft 2 7,590 7,337 Revenue Energy Intensity MWh per million USD 15.01 13.16 Office Area Energy Intensity MWh per Thousand ft 2 19.69 17.63 Data Coverage Percentage of global operations 100% 100% Data Coverage Percentage of global operations 100% 100% [a] Energy values have been third-party verified for all reported years, with limited assurance [b] Includes 7 months Wood Nuclear Group (acquired March 2020) [c] Includes Buffalo Group (acquired November 2020) [d] Metric for all scope 1 and scope 2 related energy consumption [e] Metric for scope 1 and scope 2 energy consumption associated with office space (for example, does not include mobile combustion sources)
FY21 ESG Disclosures July 2022 Unaudited 16 ENV.10 Water Consumption The following table summarizes our water consumption. Table 10. Water Consumption Water Consumption Unit FY19 (estimated) FY20 (estimated) FY21 (estimated) Total water consumption Million cubic meters 0.295 0.171 0.076 Data Coverage (as % of denominator) Percentage of global operations 100% 100% 100% Jacobs consumes and discharges water through municipal water and sewer systems to support our office operations. Water consumption and discharge is not regarded as a significant environmental impact; therefore, water-related goals and targets have not been established. In addition, very little data is available, as water consumption is included within service charges from lessors. Total water consumption is estimated using employee headcount data of those commuting into the office for each year reported. Water consumption while teleworking is excluded. For FY20 and FY21, while the total number of Jacobs employees increased, the COVID-19 pandemic reduced the number of employees commuting into the office and thus total office water consumption decreased. Our water consumption estimates and planning are informed by the Resource Efficient Scotland Green Office Guide and the WRAP Green Office Guide . We are working to collect more information from our offices to ascertain actual water consumption so we can determine what is needed to reduce our consumption in line with best practices. ENV.11 Biodiversity and Natural Capital All companies use natural capital, directly or indirectly, to support operations and growth. While our activities at existing office locations may have an indirect impact on biodiversity and heritage resources, they are not considered significant impacts regarding our own business operations. We have greater opportunity to drive positive impact through the projects and services we deliver. Our Global Environmental Management Commitment Statement includes a goal to protect species and habitat biodiversity, heritage resources and wildlife. Potential significant impacts on biodiversity and heritage from project design and delivery, depending upon the nature and scope of services provided, are mitigated by our HSE processes, systems and subject matter experts as described in section SOC.12 Health, Safety and Environment - Management of this document. An internal Environmental Screening Checklist was developed for use by Jacobs staff during field project or construction site visits where we have responsibility for the work performed. Activities that present a potential significant environmental impact or concern must be reviewed by a Jacobs Environmental Manager. This checklist includes screening for previous audits, incident notification and reporting, site housekeeping, pollution prevention, protected species and habitat, air emissions, land disturbance/excavation/stockpiling, stormwater management, water/wastewater discharges, waterways and wetlands, and material and waste management. We also protect biodiversity in our services by promoting green infrastructure solutions, which harness the power of natural capital to provide ecosystem services, including biodiversity consultation, to address resource constraints and challenges. Furthering our positive impact, we engage in various external initiatives to advance nature-based solutions and broader natural resilience. For example, we have a strategic partnership with Biomimicry 3.8, providing “Project Positive” design solutions for clients. For more information on this and other thought leadership contributions, see the “ Nature as a Solution ” section of our Climate Action Plan . Jacobs understands the importance of nature-based solutions and broader natural resilience in managing societal challenges, which has been accelerated by the Taskforce on Nature-related Financial
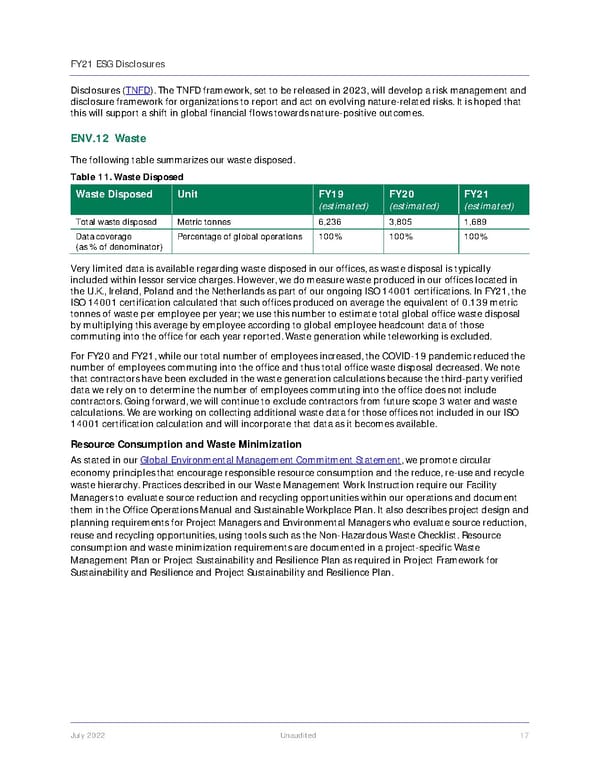
FY21 ESG Disclosures July 2022 Unaudited 17 Disclosures ( TNFD ). The TNFD framework, set to be released in 2023, will develop a risk management and disclosure framework for organizations to report and act on evolving nature-related risks. It is hoped that this will support a shift in global financial flows towards nature-positive outcomes. ENV.12 Waste The following table summarizes our waste disposed. Table 11. Waste Disposed Waste Disposed Unit FY19 (estimated) FY20 (estimated) FY21 (estimated) Total waste disposed Metric tonnes 6,236 3,805 1,689 Data coverage (as % of denominator) Percentage of global operations 100% 100% 100% Very limited data is available regarding waste disposed in our offices, as waste disposal is typically included within lessor service charges. However, we do measure waste produced in our offices located in the U.K., Ireland, Poland and the Netherlands as part of our ongoing ISO 14001 certifications. In FY21, the ISO 14001 certification calculated that such offices produced on average the equivalent of 0.139 metric tonnes of waste per employee per year; we use this number to estimate total global office waste disposal by multiplying this average by employee according to global employee headcount data of those commuting into the office for each year reported. Waste generation while teleworking is excluded. For FY20 and FY21, while our total number of employees increased, the COVID-19 pandemic reduced the number of employees commuting into the office and thus total office waste disposal decreased. We note that contractors have been excluded in the waste generation calculations because the third-party verified data we rely on to determine the number of employees commuting into the office does not include contractors. Going forward, we will continue to exclude contractors from future scope 3 water and waste calculations. We are working on collecting additional waste data for those offices not included in our ISO 14001 certification calculation and will incorporate that data as it becomes available. Resource Consumption and Waste Minimization As stated in our Global Environmental Management Commitment Statement , we promote circular economy principles that encourage responsible resource consumption and the reduce, re-use and recycle waste hierarchy. Practices described in our Waste Management Work Instruction require our Facility Managers to evaluate source reduction and recycling opportunities within our operations and document them in the Office Operations Manual and Sustainable Workplace Plan. It also describes project design and planning requirements for Project Managers and Environmental Managers who evaluate source reduction, reuse and recycling opportunities, using tools such as the Non-Hazardous Waste Checklist. Resource consumption and waste minimization requirements are documented in a project-specific Waste Management Plan or Project Sustainability and Resilience Plan as required in Project Framework for Sustainability and Resilience and Project Sustainability and Resilience Plan.
FY21 ESG Disclosures July 2022 Unaudited 18 ENV.13 Hazardous Waste The following table summarizes our hazardous waste generation. Table 12. Hazardous Waste Generation Hazardous Waste Unit FY19 (estimated) FY20 (estimated) FY21 (estimated) Hazardous Waste Generated Metric tonnes N/A N/A N/A Data coverage (as % of denominator) Percentage of global operations 100% 100% 100% There is no significant or measurable hazardous waste generation and disposal from Jacobs' office operations. Other regulated materials used in office operations (for example, batteries and light bulbs) are either the landlord's responsibility or recycled. ENV.14 Environmental Management System (EMS) Our Environmental Management System (EMS) is integrated in our HSE Management System (HSEMS) and conforms to ISO 14001:2015. While the HSEMS applies to all locations, select office and project locations are certified to ISO 14001 as necessary to meet contract or local requirements. We are currently certified in Australia, Canada, Hong Kong, Indonesia, Italy, Malaysia, Qatar and the U.K., among others. Our environmental management policy is integrated in our HSE Policy and is expressed in our Global Environmental Management Commitment Statement . Our HSEMS process is described in Health, Safety, Environment and Wellbeing - Management . We had no significant fines or non-monetary sanctions for non-compliance with environmental laws or regulations in the past four fiscal years. ENV.15 Climate Change Climate Change Strategy We place the climate emergency and our response at the heart of our company’s FY22-FY24 strategy “Boldly Moving Forward ” and have established a central Office of Global Climate Response and ESG. This corporate function acts as the connecting point for our go-to-market solutions in which our projects now become a climate response opportunity within the framework of energy transition, decarbonization, adaptation, mitigation and natural resource stewardship. Additionally, we are coupling climate response with ESG, which is taking on heightened significance, both within our organization and externally as companies around the globe rise to the climate challenge and address urgent social issues. Our Climate Action Plan includes the headline commitments: Ensure every project becomes a climate response opportunity. Achieve net-zero greenhouse gas emissions across the value chain by 2040. Maintain carbon neutrality and 100% low-carbon electricity for our operations. Our Climate Action Plan also includes commitments relative to climate justice, climate risk, nature and biodiversity, and includes information and guidance on how our employees can take impactful climate action. We are committed to ensuring our people are aware of the risks and opportunities related to climate change, so that along with our clients, we continue to mitigate risks from climate change, facilitate the transition to a low carbon future and adapt our business to be more resilient and to thrive. In partnership with the Royal Scottish Geographical Society, we launched the Climate Solutions Accelerator online course
FY21 ESG Disclosures July 2022 Unaudited 19 to all employees to help them understand the role they can play in climate change action and continue to develop the critical green skills and solutions needed for our continually evolving world. Climate Risk and the Taskforce on Climate-related Financial Disclosures (TCFD) Climate risk and resilience pose an urgent and important risk factor for us and our clients, and our investors have confirmed their increased focus on the recommendations of the TCFD. As a supporter of the recommendations, we have made four commitments in our Climate Action Plan , that we continue to meet: Integrate climate risk analysis into company strategy and planning. Deploy climate risk technology on all pursuits and projects where climate risk is considered material. Support our clients and suppliers to undertake their own climate risk assessments, in line with the TCFD recommendations. Integrate by 2025 climate risk and adaptation considerations into each of our market sector strategies. For more information on our climate change strategy, including our approach, risk and opportunity findings and next steps, see our FY21 and FY22 Climate Risk Assessments. Since 2020 we have conducted specific climate change risk and opportunities assessments in line with TCFD recommendations. Our assessments in 2020 and 2021 explored climate-related risks and opportunities to which we are exposed through our operations and the projects and programs we deliver globally. The approach to the assessment conformed with the international standard on risk management, ISO 31000:2018 Risk Management Guidelines and follows methods that are used by our climate risk specialists in our work with our clients. Scope and context: The assessment focused on projects across the main market segments of our People & Places Solutions (P&PS) line of business. These were from five of our major geographies: Australia, Canada, India, U.K. and the U.S. The risk framework was specially developed for the assessment. It enabled risk to be assessed with respect to a range of objectives, including health and safety, client relationships, regulatory compliance, reputation, and service delivery. Scenario analysis: Recognized and described risks that may prevent Jacobs and our clients from achieving our objectives under our 1.5°C and 4°C scenarios – (RCP [Representative Concentration Pathway] 2.6 and 8.5, respectively). Risk analysis: The characteristics of the risks were established, including their potential impacts, consequences and the likelihood of the climate-related events that cause these. Controls that were applied to reduce the climate risks, including those accounting for the effects of projected climate change, were captured and risk was assessed with these in place. Risk evaluation: The combination of likelihood and most severe consequence were used to assess risk severity. Disruption to business for environmental end markets is a case study of a transitional risk we have identified, assessed and are responding to. We could see business risks ($10 million to $100 million per year) from disruption to major client revenue streams, and a similar loss of revenue from reduced services for fossil fuel related projects. However, this is offset by greater opportunities such as emergency management and national security ($10 million to $100 million per year), environmental planning and permitting for extreme weather impacts ($10 million to $100 million per year) and civil works including circular economy, waste management, clean energy and natural treatment systems ($10 million to $100 million per year). Analyzing our markets revealed common themes and specific insights allowing us to estimate the value of financial impacts to Jacobs.
FY21 ESG Disclosures July 2022 Unaudited 20 Because we did not anticipate any material updates to the assessment conducted in 2021, we focused our 2022 assessment more on physical and transitional risks and opportunities, and on adaptation measures in the water market specifically. In 2021, we identified the water market as having the greatest net financial opportunity of all our market areas. Adaptation planning is also most strongly established in the solutions we deliver within the water market, making this market well-placed to extend this proven approach to our business planning. Specific goals of the assessment were to: Pilot a collaborative approach to applying scientific and strategic insights into climate change and the low carbon transition to understand key risks and opportunities for our clients and their implications for our own business. Develop a proof of concept that can be repeated across other markets. Integrate our OneWater thought leadership with an adaptive planning approach to define the water management challenges that are unique to our clients, communities and our watersheds in regions across the world. Develop a refined TCFD assessment that: - Serves as a global example of best practice for understanding and managing climate risks and standardizing climate disclosures in the water sector - Strengthens our ability to support our global water clients with understanding the complexities and importance of climate disclosures - Guides development of TCFD assessment across all Jacobs’ markets Our 2022 assessment further expanded on our IPCC scenario analysis used in 2020 and 2021, and we adopted the Network for Greening the Financial System’s (NGFS) climate scenarios framework to map out risks and opportunities specific to a rapid and orderly, and a delayed and disorderly transition to a net-zero future. ENV.16 Carbon Pricing Carbon pricing is a way of recognizing that carbon emissions create a cost to society (for example, in the form of climate change and air pollution), providing a financial incentive for businesses to transition to a low carbon future. Governments implement carbon pricing through carbon taxes or regulatory schemes such as emissions trading systems, and an increasing number of businesses are adopting an internal carbon price to acknowledge the cost of carbon to society and help guide decision-making and investment. On January 1, 2022, we introduced an internal carbon price of $50 USD per metric ton of CO2e applied to non-billable business travel at Jacobs. The carbon cost is charged to the applicable business unit. A proprietary travel booking tool provides estimated carbon emissions and price for employee-planned travel to influence travel behaviors. The revenue generated by carbon pricing is directed into a Carbon Reduction Fund and will be used to invest in initiatives, technologies and projects at the local, regional and global levels that address the climate emergency, reduce greenhouse gas emissions, and enable Jacobs to reduce its carbon emissions. The Carbon Reduction Fund will be administered by the Office of Global Climate Response & ESG, and recommendations for investment will be reviewed and approved by the PlanBeyond Executive Steering Committee.
FY21 ESG Disclosures July 2022 Unaudited 21 ENV.17 Low-Carbon Transition Plan, Products and Services Since the release of our initial Climate Action Plan on the 50th Anniversary of Earth Day in 2020, we are proud of our progress and achievements, including: We are the first consultancy and one of the world’s first companies with net-zero targets approved by SBTi. We reduced our carbon emissions by 52% between FY19 and FY21, including scope 1, scope 2 (location-based) and scope 3 (business travel). We procure the equivalent of 100% low-carbon electricity for our operations. We are a carbon neutral organization. We also recognize that much more must be done across our industry and our clients’ industries. Our latest Climate Action Plan lays out our next phase of climate mitigation and adaptation commitments, which build on the progress we have made. We are committed to continue driving the rapid decarbonization of our operations and value chain, while also accelerating the essential shift to a zero-carbon economy through the solutions we deliver to clients every day, worldwide. In parallel, we want to continue to improve our and our clients’ business resilience by embedding adaptive measures across all our end markets, considering climate risks and opportunities in alignment with the TCFD. Our Low-Carbon Transition Plan (LCTP) is summarized in the following paragraphs with links to relevant detail. It includes our strategy for delivering this transition as well as the measures, key performance indicators and levels of accountability integrated into our business to ensure success. LCTP Governance Our Office of Global Climate Response & ESG leads on delivering our climate commitments for our business and clients, including overseeing our climate-related disclosures. Our PlanBeyond Executive Steering Committee is the governance body with oversight for climate risk and the delivery of our Climate Action Plan . This committee includes all members of the Executive Leadership Team, plus our Senior Vice President for Global Climate Response & ESG, Head of Investor Relations, Head of Enterprise Risk Management and Corporate Secretary. Climate-related risks and opportunities and ESG are integrated into our Enterprise Risk Management processes. Regular updates are reported to the Board of Directors by our Office of Global Climate Response & ESG. We established a dedicated Board ESG & Risk Committee in April 2021; the committee charter provides an overview of the group’s purpose and responsibilities. Our Board Audit Committee provides oversight of the controls and processes related to material public climate disclosures. LCTP Scenario Analysis To ensure we are fully considering physical and transitional risks and opportunities from climate change, we have applied two different types of scenario analysis. Our FY21 Climate Risk Assessment was based on scenarios derived from the United Nations Framework Convention on Climate Change and the IPCC. We considered risks and opportunities associated with: Successful implementation of the Paris Agreement on climate change to limit global temperature change during this century to 1.5°C above pre-industrial levels. Continued high growth in GHG emissions leading to average global warming of around 4°C by 2100. This scenario broadly coincides with the IPCC’s RCP8.5 scenario (from its Fifth Assessment Report, AR5). To further explore potential transitional risks from climate change for our FY22 Climate Risk Assessment, we adopted the Network for Greening the Financial System’s (NGFS) climate scenarios framework . The
FY21 ESG Disclosures July 2022 Unaudited 22 NGFS framework provides a set of harmonized transition pathways and, unlike other climate models, it includes metrics that are key to understanding the prolonged and chronic impacts of climate change on regions and on GDP. For our FY22 climate risk assessment, we considered two of the four scenarios, Orderly and Disorderly: The Orderly scenario assumes climate policies are introduced early and become gradually more stringent. Our first scenario anticipated net-zero greenhouse gas emissions being achieved by 2050 and global warming being limited to 1.5°C. As highlighted by the IPCC in AR6, this expression of the orderly scenario would require a rapid low- or zero- carbon transition (that is, commencing immediately). The Disorderly scenario assumes effective climate policies are not introduced globally until after 2030. Because actions are taken relatively late and limited by available technologies (including limited assistance of carbon dioxide recovery), emissions reductions post 2030 need to be sharper than in the orderly scenario to limit warming. The delayed transition almost certainly leads to greater warming (and hence physical risk) than a rapid and orderly scenario, but with lower early transition risk. Our IPCC and NGFS scenario analysis outcomes can be found in our FY21 and FY22 Climate Risk Assessments. LCTP Financial Planning and Analysis We evaluate our project outcomes and estimate our revenue in alignment with ESG, grounded in the United Nations Sustainable Development Goals (SDGs) and 169 underlying targets. Our project classification system is founded on a Market-Submarket-Project Category hierarchical taxonomy, providing a consistent framework for evaluation over time. We disclosed the results of our FY21 revenue assessment in alignment with ESG, with the results broken down by market and disclosed in our March 2022 company strategy presentation . The project classification system has undergone refinement in FY22, with the intention of increasing data confidence and facilitating ongoing improvements for future reporting. For details on how our climate-related risks and opportunities may impact our company’s business model, strategy and outlook, see our FY21 and FY22 Climate Risk Assessments. LCTP Value Chain Engagement and Initiatives LCTP Supply Chain Engagement In January 2021, we made a 3-year commitment to CDP as a supply chain member to engage our suppliers, pinpoint risks and identify opportunities to support our suppliers in reducing carbon emissions and strengthening their climate resiliency. We were recognized on CDP’s 2021 Supplier Engagement Leaderboard for engaging our suppliers on climate change and “playing a crucial role in the transition towards the net-zero sustainable economy.” For more details on our supply chain management, refer to section GOV.2 Supply Chain of this document. LCTP Employee Engagement We know that every employee must take responsibility for driving sustainability and climate action, regardless of their role. We are building a Jacobs where our entire workforce considers sustainability a cultural imperative, and every employee is empowered to contribute meaningfully toward climate action. In the year leading up to COP26, our employees were encouraged and incentivized to take part in the Climate Countdown Challenge through our employee engagement and education platform, Collectively ℠ . Over twelve months, 1,000 employees completed more than 13,000 positive actions to reduce their carbon footprint, saving the equivalent of 320,000 kilograms of CO2. We also launched the Climate Solutions Accelerator course to our global workforce, supporting the company’s learning culture for future green skills in climate response. A collaboration between the Royal
FY21 ESG Disclosures July 2022 Unaudited 23 Scottish Geographical Society , University of Edinburgh, University of Stirling and the Institute of Directors Scotland, the course provides a quick, simple and rounded introduction to the fundamentals of climate change. Jacobs’ business units are now required to report user completion rates on a quarterly basis. For more information on our employee engagement activities, see PlanBeyond 2.0 and our Climate Action Plan . LCTP Products & Services We consider our low-carbon "product" as the range of solutions we provide that support the low-carbon transition across our end markets (that is, spanning digital products to professional services, or a combination of both). We have over 400 subject matter experts providing low- and zero-carbon related services, and over 16,000 practitioners across our water, environment and energy markets who support other low carbon and sustainability projects, including ESG advisory, sustainability strategy, emissions accounting and transition planning. We partner with a range of government agencies, municipalities, private sector companies, and leading environmental organizations to deliver resource management, sustainability services and proven industry expertise on infrastructure initiatives around the globe. Our teams are actively working on finding financially feasible options for our clients to reduce the embedded and operational carbon footprints of buildings, roads, water systems and other infrastructure through greener building materials, reduced quantities of materials, and designs that maximize energy efficiency and minimize waste. We estimate that our FY21 ESG-related revenue is approximately $6 billion. This is a broader definition than just our low- and zero-carbon related solutions and includes work across the following markets: clean and affordable energy, air quality, environmental management, environmental planning for transportation, public and mass transit, water resource management, supply and treatment, environmental science, wastewater treatment, sustainable buildings and cities, hazardous waste, and nuclear waste remediation. For more information on our ESG revenue, see our Investor Roadshow materials (March 2022) on Jacobs’ Investor Relations microsite , including both our FY19-20 and FY21 verification statements. Our Global Sustainability and Climate Action Practice focuses on key service areas that enable our clients to envision and achieve the most ambitious sustainability and climate action goals. These services include sustainable performance improvement, carbon management and reporting, net zero facility, campus, and city design; utility scale renewable energy; distributed renewable energy; energy storage integration; and corporate decarbonization. We help our clients establish their baselines and create strategies to achieve their goals, ultimately improving performance while also saving costs and resources. Additionally, our Solutions and Technology experts have indirect influence to incorporate low or no carbon products and solutions into consulting and capital projects worldwide, especially in municipal water, transportation, and waste systems. Climate Response is foundational to our 2022–2024 company strategy “Boldly Moving Forward,” and we continue to invest in building an agile, digitally-enabled workforce to combat the climate crisis, delivering end-to-end solutions that we co-create with our clients. Our Operations and Maintenance staff are continually seeking ways to reduce energy use and process GHG emissions as we provide operational management of water and wastewater, utility and other systems for clients such as local governments and defense agencies. For example, our recent partnership with Palantir enables us to aggregate and analyze plant data to manage and optimize water and wastewater treatment plant operations and maintenance, aimed at reducing costs and improving plant performance. Our environmental solutions team is working with many clients on cutting-edge technology for contaminated site remediation and integrated waste management. Experts in our climate risk and resiliency practice support clients in managing the impacts of climate change, which includes the broad use of natural infrastructure solutions to build carbon sinks as engineered solutions for flood protection. We know resilience is an attribute of a smarter planet and requires planning and adapting ahead of potential threats like hurricanes, crumbling bridges and global pandemics. We help our clients survive, recover, adapt and thrive through change, no matter what adversities they experience.
FY21 ESG Disclosures July 2022 Unaudited 24 LCTP Client / Customer Engagement We routinely advise clients on energy transition and energy efficiency opportunities, including conducting energy audits, and on securing low-carbon power supplies and developing onsite renewable generation. Our teams are also actively working to help build green economies throughout the globe, including focus on new hydrogen production technologies and connecting those producers with green energy suppliers and end users for the avoidance of carbon-based fuels. For specific project examples demonstrating our range of low-carbon products and services, see our FY21 Integrated Annual Report "We Aim Higher" section and our 2021 ESG Investor Presentation . To support our clients in achieving their sustainability objectives, we have also developed a number of sustainability-focused digital products, including: Evolve , our tool for breaking down the global themes and issues captured in the U.N. SDGs into more practical, tangible and measurable project- and program-level commitments that help educate and inspire our teams to deliver SDG-focused actions. Climate Risk Manager , a cloud-based platform that brings together global climate data and location intelligence, giving users visual risk assessments, so they can make faster and more accurate decisions on where to invest limited resources and guard against climate risks. Value Plus, an internal online platform that enables us to record, quantify and report the value-adding activities we deliver to our clients. Savings can be recorded in terms of financial costs, carbon emissions, energy consumption, waste avoidance, green building certification, and community and social benefits. LCTP Direct Operations Our direct scope 1 emissions relate to our vehicle use and energy consumption for those offices of which we have direct control. Our indirect scope 2 emissions comprise emissions associated with electricity and heating purchased by Jacobs for leased offices. Refer to our Climate Action Plan and sections ENV.4 Greenhouse Gas Emissions - Scope 1 (Direct) and ENV.5 Greenhouse Gas Emissions - Scope 2 (Indirect) of this document for detail on our ongoing scope 1 and scope 2 emissions reduction activities. LCTP Policy Engagement In alignment with our climate ambitions and strategy, we engage with a range of government, non-profit, industry group and multi-stakeholder organizations to accelerate climate response, including those at the local, national and international levels. Examples include our strategic partnership with the World Climate Forum, World Economic Forum Alliance of CEO Climate Leaders, U.S. Environmental Protection Agency Green Power Partnership, The Climate Registry’s Net-Zero Portal, Science Based Targets initiative’s (SBTi’s) Technical Advisory Group (TAG), U.K. Pledge to Net Zero initiative, Business in the Community Net Zero Taskforce, and UN Global Compact CFO Coalition for the Sustainable Development Goals (SDGs). We are also a supporter of the United Nations’ Race to Zero campaign and the Business Ambition for 1.5°C commitment. We make efforts to align our policy engagement with the goals of the Paris Agreement to ensure we are on a net-zero trajectory, while also encouraging and partnering with others to achieve a net-zero future. In June 2022, we submitted a public comment in response to the U.S. Securities and Exchange Commission (SEC) proposed rule: The Enhancement and Standardization of Climate-Related Disclosures for Investors. LCTP Risks & Opportunities Refer to our FY21 and FY22 Climate Risk Assessments for detail on our risks and opportunities related to climate change and the low carbon transition, including information on business planning and strategies to minimize risk and maximize opportunity.
FY21 ESG Disclosures July 2022 Unaudited 25 LCTP Targets We have approved near- and long-term science-based emissions reduction targets with the SBTi. See section ENV.3 Greenhouse Gas Emissions of this document for more detail. LCTP Scope 1, 2 and 3 Accounting with Verification Our GHG limited assurance verification statements covering scope 1, 2 and 3 emissions can be found on the Jacobs Investor Relations ESG microsite , including both our FY19-20 and FY21 verification statements. ENV.18 Environmental Impact in Project Design and Delivery We prioritize and embed environmental considerations into the way we deliver projects and solutions through a variety of tools, platforms and processes. Our integrated Business Management System (BMS) establishes the “one Jacobs way” to ensure consistency and efficiency in internal operations, sales and project delivery. Through our HSE Program and BMS, we implement an environmental management system that conforms to ISO 14001 and is integral to delivery of all project phases, including siting, design, construction and operation. Our sustainability process within the BMS was developed to provide rigor and drive progress by embedding sustainability into our end-to-end project delivery process; it includes global policies, procedures and resources to equip our people to achieve positive environmental and social impact across our range of client solutions. At the onset of project pursuits, we use a Client Success Platform to tag business opportunities that align with the U.N. SDGs. We are also enhancing our evaluation of ESG risks in the go/no-go decision-making process for project opportunities. Once we are engaged to deliver a project, environmental aspects and potential impacts are further identified, categorized and prioritized via our environmental risk assessment process and proprietary risk register tool. Potential environmental risks may include, but are not limited to, ecological impacts, biodiversity impacts, emissions to air, discharges to water, slope disturbance, soil disturbance and erosion, storm water management, waste management, natural resource consumption, and hazardous chemical usage. This process is global, and adjustments are made to address requirements specific to business unit, regional and project differences. Results of this analysis are logged in the Risk Assessment and Mitigation Plan (RAMP) tool. As a priority on our delivery of major projects and programs, the inclusion of climate and natural hazard and resilience risk assessments, as well as adaptation, mitigation and decarbonization planning is recommended. After the project environmental assessment is conducted, significant impacts are addressed in an environmental plan (typically integrated into the project HSE plan), which is required by us for all field projects. The environmental plan addresses all identified adverse environmental impacts such as waste management, reducing biodiversity impacts, emissions to air, discharges to water, natural resource consumption, and hazardous chemical usage. The plan sets environmental objectives and targets for the project, which are monitored, reported and reviewed periodically, depending on the project duration. Legal requirements, including national, state, local and project-specific permit conditions, establish minimum project expectations in the plan. Internal audits are conducted to verify compliance with Sustainability and HSE plans and processes. They are scheduled by the Region or Business Unit HSE Lead following the Audit Schedule Work Instruction, with the level and frequency determined by the risk profile, performance trends, client feedback and requirements for external accreditation or management system certification. Audits are conducted by the Audit Manager following our Audits Procedure and logged in our Audits application for tracking. Corrective actions are logged in our CAPA application for tracking to ensure actions are properly implemented before closeout.
FY21 ESG Disclosures July 2022 Unaudited 26 Additionally, it is now required for Jacobs project teams to develop Sustainability and Resilience Plans as part of the project execution planning stage. The project team is required to set specific goals and assign a Sustainability Lead to monitor performance and influence sustainable decision-making throughout the project delivery. Our Evolve tool provides the ability for project teams to evaluate project scope and provide recommendations on specific key performance indicators to track and measure progress aligned with the U.N. SDGs. To further propel the integration of environmental considerations in project delivery, we recently onboarded 12 Sustainability Leads across our two lines of business. In partnership with our corporate ESG team, these leads help educate, spread awareness, and drive adoption of the sustainability requirements within the BMS and PlanBeyond 2.0 sustainable business objectives across our global project portfolio.
FY21 ESG Disclosures July 2022 Unaudited 27 SOCIAL SOC.1 Introduction At Jacobs we put people at the heart of our business. We have an unparalleled focus on inclusion, with a diverse team of visionaries, thinkers and doers. We embrace all perspectives, collaborating to make a positive impact across the communities in which we live, work and play. We invest in our people, prioritizing initiatives to help them develop their capabilities and careers, improve wellbeing, and increase flexibility and creativity. And we make decisions guided by our values: We do things right. We challenge the accepted. We aim higher. We live inclusion. SOC.2 Employee Engagement We are committed to fostering a culture in which our people feel celebrated, supported and heard, empowering them to deliver extraordinary solutions to solve our clients’ toughest problems. We understand that culture is a key component of an employee’s decision to remain and stay engaged with an organization, and we have made investment in our culture a top priority. We endeavor to continuously evaluate and build upon our employees’ understanding of and commitment to our values, culture, strategy and brand through various mechanisms, including global surveys. Culture Survey – Methodology In FY21 our people took the time to share honest, unfiltered feedback in our confidential Culture Survey. Building on the methodology of our FY19 Brand Survey, our FY21 Culture Survey expanded our focus from brand awareness and engagement to cultural alignment and engagement, broadening the scope of dimensions assessed. The survey was sent to all Jacobs employees, and we obtained a participation rate of 50% of our global workforce, representing all lines of business and regions of operation. We measured employee engagement based on two key index questions, which were also used in our FY19 Brand Survey to calculate engagement: on a scale of 1 to10, with 1 being lowest understanding or commitment and 10 being the highest, (1) how well do you understand Jacobs’ values? and (2) how committed are you to Jacobs’ values? Active engagement was defined as when an employee selects a value greater than or equal to 8 for both questions. Additionally, the survey assessed 18 key dimensions that were reflective of Jacobs’ culture and employee engagement, with examples including: alignment and accountability, employee experience and trust. Culture Survey – Key Findings The results of our Culture Survey were overwhelmingly positive, with the majority of respondents feeling connected to our values, inspired by our culture of integrity, safety and inclusion—and proud to be part of Jacobs. As summarized in Table 13, our FY21 Culture Survey results showed that 62% of Jacobs employees are “actively engaged,” a notable increase from the 40% of “actively engaged” employees based on the same methodology in our FY19 Brand Survey. We take pride in this improvement, particularly given the challenges posed by the COVID-19 pandemic and increased remote workforce. We performed dynamic and cross-sectional analysis of our FY21 Culture Survey results to understand trends and correlations between employees’ age, company tenure, diversity status, business unit, region and other categories in comparison to their self-reported understanding of company strategy, alignment with company values, sense of belonging and beyond, all of which factor into our ability to retain talent. Based on this analysis, we identified several key cultural strengths, including integrity and safety, pride in Jacobs, connection to company values, inclusion and diversity, flexible remote working, and mental health commitments. Additionally, we identified six priority areas to continue improving upon our culture and level of employee engagement. These included evolving and embedding Jacobs’ strategy, emphasizing employee wellbeing, accelerating digital employee experience, strengthening leadership accountability, demystifying employee networks, and living inclusion every day.
FY21 ESG Disclosures July 2022 Unaudited 28 Culture Survey – Action Planning & Next Steps For each strategic priority area, we developed detailed action plans and identified executive sponsors to be visible champions in driving progress. Our Senior Leadership Team is responsible and accountable for ensuring we make improvements, and we cascaded survey results to team leaders globally, tailored to their specific regions and business units to inform planning and decision-making regarding their people. To further foster transparency across the organization and showcase how employee voice is shaping the future of Jacobs’ culture, we shared the survey results, follow up priorities and action plans with all employees via channels including global townhalls, email communications, and targeted briefings from team leaders and HR partners. All employees also had access to a dashboard so they could personally review results. To continually evaluate progress in the six strategic priority areas and identify new opportunities for growth, we will conduct smaller, periodic pulse surveys, with the first deployed in January 2022. We will analyze these results to measure performance against our action plans and inform decision making to continue enhancing culture and employee engagement. Table 13. Employee Engagement Metric FY19 (Brand Survey) FY21 (Culture Survey) Employee engagement (% of actively engaged employees) 40% 62% Data coverage (% of total employees provided with survey) 100% 100% Response rate (% of total employees who responded to survey) 15% 50% SOC.3 Inclusion and Diversity – Strategy Creating a Culture of Belonging At Jacobs, we are committed to creating a culture of belonging where everyone can thrive — a culture that we call TogetherBeyond ℠ . Creating this culture allows us to recruit and retain the best global talent and drive innovative solutions for our business, clients and communities. Through TogetherBeyond, we tackle topics that are important to our employees such as equality, conscious inclusion and allyship. While providing training and resources to our people is important – over 97% of them have completed our Advocate & Ally inclusion learning program – equally effective are the regular authentic and courageous conversations the members across our eight grassroots employee networks are creating around these topics. We are committed to holding all leaders accountable to making sure that broad-based diversity is reflected in their own teams, using data analytics to measure our progress with the same rigor and transparency as our financial performance metrics. Inclusive behaviors are now a key formal component of all our leaders’ performance and salary reviews, and all leaders at Vice President (VP) level and above are required to mentor two or more junior members of staff, at least one of whom must have a different lived experience from themselves (for example, on the basis of race, ethnicity, gender, gender identity, sex, sexual orientation, geography, disability or veteran status). With this framework in place, we can be confident of delivering on bold, aspirational goals such as those of our 2025 aspirational 40:40:20 goal (40% men, 40% women and 20% any gender) to ensure we are propelling a new generation of diverse visionary thinkers throughout our company.
FY21 ESG Disclosures July 2022 Unaudited 29 Action Plan for Advancing Justice & Equality Our focus on creating equal opportunities within Jacobs, including among historically underrepresented groups, continues to increase as we deliver on the promises laid out in last year’s global Action Plan for Advancing Justice and Equality . In alignment with TogetherBeyond, this plan sets actionable initiatives and measurable objectives to address embedded and systemic racial inequities across three pillars: (1) amplify a culture of belonging; (2) recruit, retain and advance Black employees based on merit; and (3) contribute to structural change in the broader society. This third pillar includes a commitment to donate $10M over the next five years in support of Black educational and professional development and scholarship opportunities. We have made progress delivering on this goal, including contributions designed to tangibly benefit the Black community and help create a new generation of Black talent through targeted Science, Technology, Engineering, Arts and Mathematics (STEAM) programs. Examples include a partnership with SEED LA’s new campus in South Los Angeles, scholarships for outstanding Black students at the University of Connecticut and with the Cowrie Scholarship Foundation in the U.K., and a Tier 1 partnership with Howard University where Jacobs is renovating a computer lab and creating five scholarships. Attracting & Retaining Diverse Talent At Jacobs, we understand that “inclusion” is a verb, not a noun. It means being transparent and taking action on our statements, commitments and initiatives to drive meaningful, measurable change both in our company and in the communities that we serve. It means creating a workplace where our differences are accepted, celebrated and harnessed to bring the innovative, extraordinary solutions clients demand from us, and to attract and retain a diverse team of visionaries, thinkers and doers. We strengthened our commitment to developing and hiring the best diverse talent with organizations including the National Society of Black Engineers (NSBE), Black Engineer of the Year Awards (BEYA) and Women of Color in STEM (WOC). We are a proud member of NSBE’s Board of Corporate Affiliates at their top national support level. We also partner with Society of Hispanic Professional Engineers (SHPE), the Society of Women Engineers (SWE) and Building Equality , the U.K. construction industry’s leading LGBTQ+ alliance to further support our retention and recruitment efforts of underrepresented talent. We also continue to work to recruit, develop and retain the best military and veteran talent, partnering with key organizations like Hiring Our Heroes, Boots2Roots and HirePurpose. We are proud to have received the HIRE Vets Gold Medallion for Veteran Recruiting. In partnership with McKinsey, nearly 300 Black, Latinx and Asian employees are participating in Connected Leaders Academy programs, which seek to create a unique learning environment and safe space for sharing common experiences, while providing the participants with the opportunity to build their networks and become part of a new wave of Jacobs leaders. Our Black and Latinx employee networks, Harambee and Enlace, continue to lead STEAM outreach efforts in the communities that we serve and are working to bring a new generation of diverse visionaries from underrepresented and underserved groups into the industry. In partnership with our Women’s Network, we launched gender-balanced interview teams, provided flexible working arrangements, improved caregiver leave, rolled out our first domestic violence policy in Australia and New Zealand, piloted a “Male Champions of Change” allyship program, and created “Bridge the Gap,” a program that actively supports parents returning to work. In addition to the above, we promote an inclusive environment for our diverse workforce via many approaches, including: Offering Conscious Inclusion and Advocate & Ally training for all employees Incorporating inclusion as a key focus area in leadership development programs Investing in diversity recruitment
FY21 ESG Disclosures July 2022 Unaudited 30 Promoting and conducting pay equity analysis Making it easy for employees to participate in employee network groups Fostering a company culture where every voice is welcome, heard and respected Extending flexible workplace solutions Keeping pulse on culture via employee surveys Encouraging all US employees to use the paid Martin Luther King Jr. holiday as a day focused on reflection and community service For more information on Jacobs’ inclusion & diversity policies, programs and achievements, see our FY21 Integrated Annual Report. SOC.4 Inclusion and Diversity – Workforce Metrics Workforce Composition by Employee Category As of October 1, 2021, we had a workforce of approximately 55,000 people worldwide, including a contingent workforce of 3000 people. Of our directly employed Jacobs workforce, approximately 91% were full-time employees and approximately 9% were part-time employees. Of our full-time employees, approximately 98% were permanent employees and 2% were temporary employees. Of our Jacobs total workforce, approximately 84% were full-time permanent employees, approximately 7% were part-time permanent employees, approximately 4% were temporary employees, and approximately 5% were (not directly employed) contractors/contingent workers. Unless otherwise noted, the workforce data that follow are based on Jacobs’ global, permanent staff employee population. Table 14. Workforce Composition by Geography Region FY21 Percentage of global workforce Americas 61% Europe (including U.K.) 23% Asia Pacific (including India) 13% Middle East and Africa 3% Table 15. Gender Diversity by Management Level (Global) Representation of Women by Management Level FY21 (%) Executive Management (CEO, EVP, SVP II) 38.1 All executives (VP+) 26.9 All other employees (non-executive / below VP) 29.7
FY21 ESG Disclosures July 2022 Unaudited 31 Table 16. Gender Diversity by Management Level and Job Type (Global) Indicator FY18 (%) FY19 (%) FY20 (%) FY21 (%) Female share of total workforce 29.0 29.5 29.5 29.7 Females in all management positions As a % of total management workforce; includes junior, middle and senior management 24.4 24.4 22.2 23.7 Females in junior management positions As a % of total junior management positions; first level of management 24.4 28.0 27.0 27.5 Females in top management positions As a % of total top management positions; maximum two levels away from CEO [a] 29.4 32.4 33.3 38.1 Females in management positions in revenue-generating functions As a % of all such managers; excludes support functions such as Human Resources, Information Technology, and Legal 20.9 19.2 19.8 21.2 Females in STEM-related positions (estimated) [b] As a % of total STEM positions - - 26.0 26.0 [a] Females in top management positions calculated based on employee levels: Senior Vice President II (SVP II), Executive Vice President (EVP), and Chief Executive Officer [b] STEM percentage is based on available data and excludes Jacobs’ CMS-US line of business due to different data system requirements; we are working to improve our processes for more precise STEM data in future disclosures. Table 17. Racial/Ethnic Diversity (US Only) Employee Ethnic Group Description FY20 % of US Total FY21 % of US Total Asian 6.8 7.1 Black or African American 8.5 8.6 Hispanic or Latino 9.0 9.3 Two or More Races 2.0 2.3 Native Hawaiian/Other Pacific Islander 0.4 0.4 American Indian or Alaska Native 0.4 0.5 White 71.5 70.0 Unknown or Not Provided 1.4 1.8 Grand Total 100% 100% Table 18. Racial/Ethnic Diversity by Management Level (US Only) Management Level Percent Racially/Ethnically Diverse FY20 (%) FY21 (%) Executive Management (CEO, EVP, SVP II) 23.5 27.8 All executives (VP+) 16.5 18.8 All other employees (non-executive and below VP) 27.1 28.1 Table 19. Diversity by Age Group (Global) Age Group FY20 % of Total FY21 % of Total Under 20 0.2 0.2 20–29 16.1 16.5 30–39 25.2 25.8
FY21 ESG Disclosures July 2022 Unaudited 32 Age Group FY20 % of Total FY21 % of Total 40–49 23.8 23.5 50–59 21.4 20.7 60 and above 13.3 13.2 Grand Total 100% 100% Table 20. Average Employee Age by Gender (Global) Population FY20 Average age FY21 Average age All employees 44 44 Female 42 42 Male 45 45 Table 21. Distribution of Gender by Age Group (Global) Age Group FY20 % of Total FY21 % of Total Female Male Female Male Under 20 29.7 70.3 26.8 73.2 20–29 36.3 63.7 36.9 63.1 30–39 32.9 67.1 32.7 67.3 40–49 30.5 69.5 30.7 69.3 50–59 25.6 74.4 25.2 74.8 60 and above 19.3 80.7 20.1 79.9 People with Disability (US Only) In FY21, approximately 1,700 (5.3%) of U.S. employees indicated “Yes, I have a disability (or previously had a disability)”. Veterans (US Only) In FY21,13.8% of U.S. employees indicated that they are veterans. SOC.5 Pay Equity and Pay Gap As part of our TogetherBeyond culture, we are working toward an aspirational goal of 40:40:20 balance globally by 2025 (40% male, 40% female and 20% of any gender). To achieve this, we recognize we must have pay equity and continue to narrow our pay gap. We are taking a range of actions to continue propelling a new generation of diverse visionary thinkers through the ranks of our company. Reflecting our commitment to advancing gender equality, we were named one of the 2022 Times Top 50 Employers for Women in the U.K. , and awarded Employer of Choice for Gender Equality by Australia’s Workplace Gender Equality. Pay Equity We are committed to ensuring our employees are compensated fairly and equitably based on the roles they perform relative to our Global Career Structure and salary scales. We strive for sustainable pay equity practices to bring employee salaries in line with similarly situated peers and align salaries to market. These
FY21 ESG Disclosures July 2022 Unaudited 33 practices set the foundation for our overall long-term strategy to attract and retain talent. We conduct multiple pay equity and promotion reviews each year to support our efforts to compensate and promote our employees in proportion to their efforts. In addition, we have an external consultant review our program on a periodic basis and provide detailed results and recommendations. We are committed to maintaining long-term, proactive approaches to monitor and resolve potential pay inequities, including utilizing pay equity analysis tools, implementing a comprehensive global grading system, conducting manager training, and engaging in continuous reviews throughout the year. Pay Gap We publish an annual gender pay gap report covering our U.K. business and highlighting actions we are taking to advance equality across our workforce. In 2020, we published our first Gender and Ethnicity Pay Gap Report, going beyond the statutory requirements by also disclosing our ethnicity pay gap results for our U.K. workforce. Our ethnicity pay gap measures the difference between average hourly pay rates for Black, Asian and Minority Ethnic employees compared to white colleagues’ average earnings. In Australia, we submit an annual report to the Workplace Gender Equality Agency in accordance with the requirements of the Workplace Gender Equality Act of 2012.For more detail on related activities and achievements, see our 2021 Integrated Annual Report ; 2021 Gender and Ethnicity Pay Gap Report for England, Wales and Scotland; and the SOC.3 Inclusion and Diversity – Strategy section of this document. SOC.6 Collective Bargaining In FY21 approximately 2000 of our employees were covered by collective bargaining agreements, representing approximately 3.6% of our global workforce. We enjoy direct relationships with our employees and the flexibility to efficiently respond to the needs of our people and our clients. As noted in Jacobs’ Human Rights Policy , we recognize the freedom of workers to associate or not associate with a labor union, and to collectively bargain when represented by a legally recognized labor union, in accordance with relevant laws and regulations. This policy is available to our people and the public on our external company website. Jacobs’ Labor Relations Policy (JJ-EB-PL-6101-JJ) further details our respect for the rights of our people to choose and make decisions regarding third-party representation, including our commitment to dealing in an honest, professional, and ethical manner with employees represented by labor unions. As part of our Business Management System, this policy and others are available to employees via our searchable JacobsConnect intranet platform. We post additional information regarding employees’ rights in visible areas within company facilities and work sites. If employees or other stakeholders have questions, concerns, or grievances regarding their rights or company policy, they may utilize our confidential Jacobs Integrity Hotline , available 24 hours a day, 7 days a week, via which reports may be made anonymously. SOC.7 Employee Wellbeing and Support Programs At Jacobs, we believe in the collective power that comes from individual wellbeing — and we define it across four pillars: physical, financial, emotional and social. The culmination of these pillars promotes optimum wellness. Rooted in this holistic view, our global wellbeing strategy is designed to support employees and their families. We evaluate our benefits and employee support programs on a regular basis, benchmarking against statutory requirements and market trends. We apply the results to inform policies, programs and partnerships to support our people worldwide. While specific offerings vary from country to country, examples include paid dependent care and special leave, support for parents, flexible working hours, remote and hybrid work arrangements, on-demand access to health providers and more.
FY21 ESG Disclosures July 2022 Unaudited 34 Parents and Caregivers We offer paid parental leave benefits that exceed statutory requirements in various a number of countries of operation. In the U.S., Jacobs’ maternity program provides 100% salary continuation of an employee’s base pay for up to 6 weeks. Employees have the option to top-up their benefit by using short-term salary continuation for additional recovery time. In addition, our Caregiver Leave policy (US-EB-PL-6441-US0) provides up to 40 hours of paid leave to support eligible full-time U.S. employees when their presence is needed to provide care and assistance to ill or injured family members, or to allow non-primary caregivers to bond with their new child after birth or placement. Leave granted under this policy is in addition to any time off granted under paid time off, vacation, statutory requirements or paid sick leave policies. We actively support new parents returning to work with continued programming and resources. We offer a virtual care resource, Maven, that helps employees navigate different pathways to parenthood such as adoption, infertility treatment and pregnancy—as well as providing postpartum and pediatric services. ReThink is another benefit, free to our employees, that provides our people and their families around-the- clock access to tools and resources to help understand, teach and better communicate with their children. In many new and renovated Jacobs’ offices across the globe, we offer dedicated Wellness Rooms, which provide a private, secure, hygienic and comfortable place to support lactating mothers in breast-feeding, pumping and storage. All Wellness Rooms are universally accessible and come equipped with a sink, undercounter fridge, mirror and storage cabinets. Privacy is ensured by having solid walls enclosing the space and lockable doors with vacant/occupied indicators. In the U.K., our internal Bridge the Gap parental transition program supports working parents before, during and after becoming a parent, providing toolkits, a parent-to-parent network, and other resources. In India, we offer “crèche” childcare facility benefits and reimbursement of some childcare costs in qualifying circumstances. Flexible Work Having flexible work options allows employees to tailor their work schedule and location to best fit their specific needs. Our Flexible Work Arrangement policies enable eligible employees to have a reduction or variation of working hours and days worked, or to work remotely. We also offer various stratifications of work status, such as regular full-time, regular modified full-time and regular part-time. In parts of the company, we have rolled out detailed flexible working handbooks to help managers have proactive conversations about flexible working practices with employees. Additional Benefits Our suite of specific benefits varies from country to country to best serve our global workforce. Beyond the topics discussed above, examples include: Paid time off and paid holidays Retirement benefits Financial planning and education programs Educational reimbursement Employee stock purchase plan Disability benefits Life and accident insurance Global giving and volunteering program Health insurance Other health benefits, such as: - On-demand help for stress, anxiety and depression - In-depth medical review, ask-the-expert and find-a-doctor services - Health concierge and wellness benefit - Flexible Spending Accounts: Health Care, Limited Purpose, and Dependent Care
FY21 ESG Disclosures July 2022 Unaudited 35 - Health Savings Account - Comprehensive family planning program - Online therapy with face-to-face video visits Voluntary benefits, such as: - Critical Illness Insurance - Legal Plan - Commuter Flexible Spending Account - Identity Theft - Auto and Home Insurance - Pet Insurance SOC.8 Hiring and Retention Table 22. Employee Turnover (Global) Metric FY18 FY19 FY20 FY21 Total Employee Turnover Rate (%) 18.6 17.9 15.4 17.4 Voluntary Employee Turnover Rate (%) 10.8 10.8 8.3 11.3 Involuntary Employee Turnover Rate (%) N/A N/A 6.2 4.9 Retirement (%) N/A N/A 0.9 1.2 Table 23. Hiring (Global) Metric FY18 FY19 FY20 FY21 New Hires [a] Total number of new employees hired 10,140 10,866 9,498 11,752 Internal Hires % of all open positions filled by internal candidates 5.3% 11.2% 12.4% 14.8% [a] Reflects new external hires, employees only, both staff and craft (excludes contractors, contingent workers, job shoppers); excludes positions filled by internal employees; may include acquisitions: FY21 includes The Buffalo Group (940 acquired employees included in the total of 11,752); FY20 includes KeyW (1,607 acquired employees included in the total of 9,498). SOC.9 Training and Development We know that the continued success of our business depends on maintaining and growing our base of talented colleagues and creating programs that are meaningful to them. Across the board, we want our employees to engage with others, excel in their role, and elevate their career at Jacobs through expanded career resources and learning opportunities. Our unique employee experience platform—e3: engage. excel. elevate.—is not just a system but a mindset for developing our employees through continuous feedback and celebrations, aligning priorities, learning new skills and upskilling knowledge. Career Planning, Feedback & Performance Appraisals Our e3 Global Career Framework provides numerous resources to help employees at all levels of the organization plan their career at Jacobs, including a structure that explains skills, competencies and experiences needed to grow their career. We have included a simple process that walks employees through each step of creating a career plan. Managers are provided tools to guide them through having career path conversations with employees, as well as how to show support and encouragement through the process. Our e3 platform promotes an open feedback culture, allowing colleagues to recognize each other for collaboration and performance year-round via online feedback engagements, providing a “360-degree” view of performance with input from an employee’s line managers, peers, direct reports and other employees. Our employees establish goals (“priorities”) and performance measures yearly in the e3
FY21 ESG Disclosures July 2022 Unaudited 36 platform and receive annual performance appraisals which include multidimensional feedback and systematic use of agreed measurable targets. In FY21 97% of our eligible employees participated in their annual conversation about their priorities and accomplishments. In between annual performance appraisals, employees also engage in mid-year and periodic performance check-ins with managers to discuss performance, adjust course and follow up as appropriate. Learning, Development & Institutional Partnerships We are committed to developing and upskilling employees at all levels of our organization and across all parts of the business. Our e3 Learning platform provides over 20,000 training programs to employees globally. The wide range of e-learnings helps employees develop a multitude of job-specific skills and work toward certifications. The courses are searchable and have been catalogued in learning spaces to highlight relevant and helpful content. These spaces include sustainability, innovation, inclusion, leadership, project delivery, health & safety, quality, technical excellence and more. In addition, we partner with universities and other external institutions to develop and provide enriched learning opportunities to employees at all levels of the business. For example, in partnership with Duke Corporate Education, we developed a culture alignment program via which more than 200 Jacobs leaders received guidance and programming to strengthen inspirational leadership and the development of inclusive, innovative teams, enhancing strategy engagement and execution across our global organization. In partnership with the Royal Scottish Geographical Society, we launched the Climate Solutions Accelerator online course to all employees to help them understand the role they can play in climate change action and continue to develop the critical green skills and solutions needed for our continually evolving world. And to encourage, support and retain our newest employees, a cohort of nearly 800 graduates from across the company participated in our Graduate Development Program in FY21. During the first two years of their Jacobs career, these graduates receive on-the-job learning, coaching and mentoring, as well as formal training Our focus in FY21 on developing our employees and driving a learning culture has been recognized by the Association for Talent Development (ATD). ATD’s 2022 BEST Award is the talent development industry’s most rigorous and coveted recognition. The global program recognizes organizations that demonstrate enterprise-wide success through talent development. Table 24. Training and Development Metrics Metric FY21 (Estimated) [a] Average hours of training per year per full-time employee 10.7 hours Average amount spent per full-time employee on training & development 700 USD [a] Training hours and spend estimated based on available data; not reflective of all training completed, as employees may log training and development hours via individual project numbers, not centralized training codes. SOC.10 Human Rights As detailed in our Human Rights Policy , we respect the human rights and dignity of people in our operations, supply chain, and communities where we work. We prohibit the use of any form of child or forced labor, slavery or trafficking of persons. Our approach is guided by international principles, including those encompassed in the U.N.’s Guiding Principles on Business and Human Rights, Universal Declaration of Human Rights, International Bill of Rights, and the International Labor Organization’s Declaration on Fundamental Principles and Rights at Work.
FY21 ESG Disclosures July 2022 Unaudited 37 Guided by our values, we have taken a variety of actions to respect human rights in our supply chain. Within the Human Rights section of our Supplier Code of Conduct , we detail human rights requirements for suppliers, including: Respect human rights in your operations, supply chain and communities where you do business and avoid any involvement in human rights abuses. Comply with applicable laws regarding equal opportunities, forced labor, child labor, human trafficking, modern slavery, working hours, freedom of association, collective bargaining, recruitment and fair wages. Treat all your workers with respect and dignity. Conduct all operations in a harassment-free and nondiscriminatory manner. Provide a confidential, anonymous mechanism via which workers may report concerns and provide whistleblowers with protection against retaliation. Provide and/or cooperate in the provision of effective remedy when adverse human rights impacts occur as a result of your activities. Never require workers to pay employers’ or agents’ recruitment fees or other related fees for their employment. Never retain or impede workers’ access to personal identification documents and possessions. Human Rights Due Diligence We conduct due diligence to avoid complicity in human rights abuses, and we seek to avoid causing or contributing to adverse human rights impacts through our own activities and business relationships. Supporting our Human Rights Policy, we introduced an updated human rights prequalification questionnaire into our supplier screening process. This dynamic, risk-based assessment includes questions related to worker accommodation, identity documents, wages, recruitment fees, grievance mechanisms, and beyond. More in-depth screening occurs for suppliers based on risk triggers including geography, activity type and employment of migrant workers. Human Rights Mitigation and Remediation Whenever possible, we operate in a spirit of continuous improvement when engaging with our suppliers. We have worked collaboratively with suppliers to raise the working and living standards of their employees, providing coaching to facilitate understanding and alignment with our human rights commitments. For example, we undertook assessments of suppliers providing support services to our offices in a high-risk region. The supplier staff were foreign migrant workers living in group accommodation, and our assessments indicated the conditions of accommodation did not satisfy our expectations. As a remedial measure, we moved the affected staff to apartments with a higher standard of living at our own cost. We also conducted an analysis of supplier staff salaries and detected stagnant wages, although aligned with market rates. To provide additional support to these workers and improve their quality of life, we made the decision to increase their wages at our expense. In addition to internal efforts, we have supported clients’ efforts to reduce human rights risks within their supply chains, including providing guidance and dedicated resources to support the development of worker welfare policies, procedures and auditing programs. For further detail on our human rights commitments and activities, see our global Human Rights Policy and Modern Slavery Statement .
FY21 ESG Disclosures July 2022 Unaudited 38 SOC.11 Community Investment Collectively Program In alignment with Jacobs’ purpose of creating a more connected, sustainable world, the Collectively SM program is our approach to corporate citizenship and philanthropic efforts. Uniting our 55,000 visionaries, dreamers and doers in a single platform for giving and volunteering, Collectively allows us to amplify the positive impact we make in our communities every day. Through our partnership with Benevity, a leading company for online workplace giving and volunteering, our people can support more than two million charities around the globe through payroll giving, paid volunteering efforts, matching campaigns and company donations. The Collectively program brings our purpose to life by enabling our people to truly live our company values, so we can push the limits of what’s possible with community engagement. Real-time reporting at micro- and macro-scale allows us to set KPIs to deliver on our strategic causes. The Collectively program is aligned with four strategic causes, cross-cutting key U.N. SDGs and Jacobs’ company values and priorities: Inclusion & Diversity; STEAM education; health and wellbeing; and sustainable development. For more information on our Collectively program, including employee matching, disaster relief response, charitable grants, volunteering, ambassador network and long-term targets, see our Collectively Program Strategy. STEAM Volunteering Jacobs’s Global STEAM Strategy is embedded into PlanBeyond 2.0 , and Jacobs has a STEAM goal to achieve 50,000 STEAM hours by 2025 while also becoming an award-winning STEAM employer. In concert with this strategy, Jacobs has launched its new STEAM education program, called the Butterfly Effect . The seven-year program is now available to anyone internally and externally because the goal is to provide equal access to young people to develop a deeper connection to sustainability. The program is designed to create long-term and sustainable behaviors in young people under 12-years old by giving them the information, knowledge and understanding needed to consider sustainability in every decision they make. The Butterfly Effect covers eight themes aligned with the U.N. SDGs: Water Plastics Waste Carbon Biodiversity Food Human Rights and Lives Jobs of the Future FY21 Contributions We are committed to giving back, engaging with communities and building enduring partnerships. In FY21, we transitioned to an open matching giving program, meaning Jacobs matches employee donations systemwide to charities of our employees’ choosing, up to a set user cap per year (excluding religious and political causes). Throughout FY21, we supported disaster relief and significant days of importance across the world through the generosity of our employee donations and associated eligible matching contributions, and through company donations.
FY21 ESG Disclosures July 2022 Unaudited 39 In FY21 we introduced paid volunteering time for STEAM education outreach activities world-wide, up to an annual user time cap. We also partnered with the Society for Science to serve as the champion of the Environmental Engineering category at the Society’s annual International Science and Engineering Fair (ISEF). ISEF is a premier pre-collegiate competition and talent pipeline that fosters the best and brightest minds through more than 400 affiliated science fairs in 80+ countries, regions and territories around the world. In FY21 our total corporate citizenship and philanthropic contributions (cash or financial plus time contribution + in-kind giving) exceeded $6.7 million. The following tables summarize our giving impact through Collectively and more broadly (see Table 25, Table Note [b] for full detail). Values have been rounded for reporting consistency. Table 25. Contributions Via Collectively Platform FY21 Summary (USD) – via Collectively Platform [a] Total Employee Donations $1.2 million Total Company Donations $2.3 million Total Giving Impact $3.5 million [a] Charitable and non-profit organization disbursements driven through Benevity. Table 26. Contributions Summary by Type of Contribution FY21 Philanthropic Contributions Summary (USD) – by Type of Contribution [a] Cash / Financial: reflects philanthropic contributions including charitable donations, community investments, and commercial initiatives and business-related activities in the community in partnership with charities and community organizations. Charitable donations through Collectively (Benevity disbursements) = $3.5 million Charitable donations and sponsorships outside Collectively = $2.9 million $6.4 million Time Contribution: accounts for Jacobs-funded STEAM volunteering undertaken within the U.K. and Ireland from October 1, 2020–September 30, 2021. Expansion of Jacobs-funded STEAM volunteering program has gone global in FY21. Employees in U.K. and Ireland charged STEAM volunteering time to both Collectively STEAM volunteering budget as well as the separate EMEA STEAM volunteering budget. EMEA STEAM volunteering = $14,000 Collectively STEAM volunteering = $53,000 $67,000 In-kind giving: accounts for donation of IT equipment within Europe and donation of legacy branded Jacobs company store items to local communities within select regions. Europe IT donations: = $9,000 $9,000 Management overheads: estimated as burdened cost of corporate Program Manager labor time [b] plus annual vendor procurement costs, which is the cost of external professional advice to manage our program. $300,000 [a] Tracking of charitable contributions as well as membership and sponsorships to community-based organizations (excluding pure charitable donations disbursed through Benevity) are collected through internal approval systems only. Currency conversions for all international (non-USD) contributions and Europe-only in-kind giving have been calculated based on the conversion rate at the end of FY21 (September 30, 2021). [b] Collectively Program Manager labor time is estimated as 75% of the individual’s yearly pay in FY21. Note: EMEA = Europe, Middle East and Asia
FY21 ESG Disclosures July 2022 Unaudited 40 SOC.12 Health, Safety and Environment – Management Health, Safety and Environment Management System Jacobs operates and maintains an integrated Business Management System (BMS), which establishes the “one Jacobs way” to facilitate consistency and efficiency in internal operations and project delivery. Several key processes comprise the BMS, including our Health, Safety and Environment (HSE) processes and procedures. Our global framework minimizes documents required by all our operations and drives consistent use of common work processes. The Jacobs HSE program is designed to provide safe and healthful workplaces, prevent work-related injury and illness, prevent damage to the environment, and enhance HSE performance and promote wellbeing throughout the organization. Leadership expectations are communicated, and roles and responsibilities are defined by assigning personal accountability for behaviors consistent with HSE values and objectives. Continual improvement is built into the HSE program and associated processes. Jacobs’ HSE processes are consistent with international HSE standards and practices, including ISO 14001, ISO 45001, US Department of Labor Voluntary Protection Programs and others. Additionally, our HSE philosophy goes beyond mere compliance with norms and standards, and we seek to be best in class and have a positive influence on the health, safety and wellbeing of our employees and partners, on the environment, and in the communities where we work. The scope of our HSE Program applies to all Jacobs activities (as relevant) that are undertaken within areas that are owned and/or controlled by Jacobs. The program is used in conjunction with Line of Business (LOB), Business Unit (BU) or other requirements related to managing HSE within specific operations. The term BU includes performance units, regional and global operating units, corporate support groups, and similar units or groups. Global Participation Jacobs is committed to an overall BMS that integrates HSE requirements and expectations and facilitates achieving HSE performance excellence. Participation at all levels is crucial and supports the company culture to ensure consistent HSE performance improvement and excellence. HSE Policy Jacobs’ global HSE Policy is established and is signed electronically by the Chair and CEO of Jacobs and is endorsed by the Executive Leadership Team. This policy reflects core HSE values in relation to the strategic direction of the company and is prominently displayed throughout Jacobs’ facilities and included in on-boarding activities for all new hires. Our environmental policy is integrated in our HSE Policy and is also expressed in our Global Environmental Management Commitment Statement . Because driving represents a significant risk to Jacobs, our Driving Safety policy establishes the driving risk management practices and driving rules for all Jacobs employees to follow when operating motor vehicles, emphasizing “the safest journey is the journey not made.” BeyondZero At Jacobs, we believe the wellbeing of our people is fundamental to our success. Our passion for safety and our courage to care for one another and our environment inspires mutual respect. It is not what we do, it’s who we are. We call it our way of life, BeyondZero®, our Culture of Caring. We are proud that in our culture, our people go beyond following rules, procedures and processes. Our goal is beyond driving statistics to zero. We believe our culture will make our people and communities safer, more secure and healthier. We look for ways to recognize and mitigate risks, on and off the job. We
FY21 ESG Disclosures July 2022 Unaudited 41 drive and promote healthy behavior and care for the environment. We have created a true culture of caring where genuine concern for each other makes it impossible to tolerate unsafe, unsecure or harmful conditions or behaviors. The principles of BeyondZero® that we live and stand by at Jacobs include: We empower and motivate each other to act We try to recognize and understand risk at all levels of our business We expect our people to demonstrate a visible commitment and responsibility for creating a safe, secure and healthy environment We extend BeyondZero® to everyone we encounter including our business partners, our clients, our families and our neighbors. HSE Strategy Our strategy, BeyondZero: To 2025 and Beyond , sets the direction and framework of action for improving health, safety, environment, security and resilience associated with our operations, maturing our culture of caring, and living our values. This strategy sets out two goals aimed at helping everyone play their part to manage HSE, security and organizational resilience risks effectively and proportionately. The first goal is getting everyone to focus on what will make the biggest impact to reduce harm. To improve our ability to do this well and manage risks, we must help every employee to understand their role, is able to do it, and plays their part. This is our second goal. These goals are driven into policy, processes and programs so BeyondZero becomes so ingrained and pervasive in the way we do things that it becomes invisible and indivisible from the rest of the work done by Jacobs and its partners. To achieve this, the strategy outlines four focus areas under each of the two goals. Reducing harm through focusing on: Employee health and wellbeing at work. Operations with greater need: high risk and high potential harm. Risks being assessed and mitigated with consideration and inclusive of employee needs. Strengthening our BeyondZero culture, understand and manage risk through organizational integrations. To effectively reduce harm, we need to have the capability, and continue to build that capability in everyone through: Engaging leaders at all levels to be visibly active in BeyondZero. Developing and sharing better data and insights to improve decision making. Boosting the BeyondZero ability of supervisors and managers. Empowering employees to be represented, engaged and to participate. Leadership Commitment Proactive management leadership and employee participation are central to our HSE program. Leadership and employees at all levels are responsible and accountable for delivering on the commitments and requirements of our HSE Policy. These commitments include: BeyondZero®, our Culture of Caring. Promotion of good health and safe behaviors. Creating and maintaining a safe work environment. Protection of the environment and prevention of pollution.
FY21 ESG Disclosures July 2022 Unaudited 42 Compliance with statutory and regulatory requirements, and conformity to applicable client and Jacobs’ standards. Integration of HSE into Jacobs’ business systems and processes. Continual improvement of our HSE management system, performance and our BeyondZero Culture of Caring. We meet these commitments by: Identifying and mitigating HSE risks in our business. Establishing clear objectives, monitoring performance and continuously improving. Defining applicable roles, responsibilities and accountabilities for Jacobs’ personnel. Informing and consulting with our employees and interested parties on matters related to HSE. Verifying training and competency of employees. Empowering employees to stop work if safety or the environment might be compromised. All Vice Presidents have formally acknowledged their commitment to BeyondZero and to establish performance objectives to deliver on the focus areas of the BeyondZero strategy. Supervision Supervisors fill an important role at Jacobs. The Jacobs HSE Program is line-management driven, and as such, the supervisor (and manager) has ultimate responsibility and authority for implementation of the HSE program in their area of responsibility. Worker Participation Worker consultation and participation in the HSE program are both expected and encouraged through our Culture of Caring as described in BeyondZero: To 2025 and Beyond . The term “worker” includes Jacobs employees, agency staff, and Jacobs-managed contractors or subcontractors where possible so that all employees performing work on behalf of Jacobs are able to participate. When employee consultation or participation is required, it is included in the appropriate written HSE policy, procedure, or guideline. Various systems are in place for employee consultation and participation, including, but not restricted to: Planning – Workers participate in preparation of HSE plans and Safe Systems of Work (described below), identification and assessment of hazards and control measures. Emergency Plans – Workers participate in development of emergency plans, emergency drills and exercises, and critiques and improvement to emergency plans. Audits and Inspections – Workers can participate as a member of audit teams and have ongoing responsibilities in conducting and documenting worksite inspections. Incident Management – Workers are often consulted and participate in incident reporting, recovery, incident analysis, and any resulting actions. BeyondZero Observation Reports – Workers play a central role in making HSE observations in their day--to-day work activities as a means to manage risk and share knowledge, practices and concerns. BeyondZero and HSE Committee (HSC) Meetings – Many offices and projects have an HSC that meets monthly to address HSE issues and improvements. BeyondZero Awards – Workers nominate projects and personnel for various HSE awards designed to encourage and recognize proactive employee participation in the overall HSE program. StepBack – The StepBack program complements the work planning process, whereby employees can step back from their activities to further evaluate risk and identify any additional hazards or impacts that may be in the work area.
FY21 ESG Disclosures July 2022 Unaudited 43 Stop Work – Employees have the authority and are expected to stop work if they believe themselves, other people, or the environment may be or are at risk, or otherwise do not clearly understand how the risk is to be managed or controlled. High-Value Learning – Employees participate in identifying and communicating lessons learned and High-Value Learnings related to their work so that others can benefit. Additional worker participation activities may be identified in LOB and BU HSE processes, as well as office- and project-specific HSE plans. Operational HSE Control and Action Plans Prioritization and integration of action plans with quantified targets to address those risks are completed via operational management plans such as HSE plans. Systems and procedures are established, implemented, and maintained to manage and control or mitigate identified HSE risks. The effectiveness of controls is verified, and opportunities for improvement are identified and implemented during the execution of work. HSE plans are prepared for all our permanent offices or establishments, including laboratories, project offices and temporary project or facilities accommodation, to identify hazards associated with each facility and its location, other stakeholder HSE expectations and legal, regulatory and emergency management requirements. Projects or programs performing field or site work prepare a project HSE plan or a Safe System of Work (described in the following paragraphs), depending upon the location, type and risk level of work being performed and client or company expectations. Secondment projects must prepare HSE plans when employees will be seconded into another organization either at an office or a project location. Operational HSE Control standards provide a consistent framework for assuring safe work operations in facilities and on projects, and the required standards based on scope of work and risks are specified in the HSE plan for action. These standards are described in Jacobs’ Operational HSE Control procedure. Additionally, the following processes established by Jacobs support the overall operational control of work. Project Start-up HSE Requirements – Specifies the minimum HSE requirements for starting work at a new facility or project site. Occupied Facility Siting – Specifies the minimum requirements for identifying and managing the risks presented by the work environment on Jacobs occupied facilities at a specific location. Fitness for Duty – Covers fitness for work assessments and medical surveillance needs depending on job risk assessments. Critical Risk Management – Outlines control of work for high- or critical-risk operations. Safe Work Permits – Describes the process used for obtaining and managing client managed or company required Safe Work Permits. Safety Observation Report – Provides information on implementation and management of the Safety Observation Report process. Stop Work – Provides the framework for the company Stop Work process to ensure that each employee has the authority, and understands the expectation, to stop work if they believe that there is uncontrolled risk to themselves, others, the environment, or the community. In addition, LOBs and BUs augment these operational HSE Control requirements as needed based on their specific organizational needs, regional, national, or local requirements, and type of work performed. Additional LOB and BU HSE requirements are found in the Jacobs BMS.
FY21 ESG Disclosures July 2022 Unaudited 44 Contractors and Contractor HSE Management Contractors are qualified, selected, and managed in accordance with Jacobs’ Global Supply Management standards including a HSE qualification (review and approval) as required by Jacobs’ Supplier Qualification process. HSE performance indicators such as incident history, written programs, and compliance history is considered when procuring Contractors. Contractors may be required to follow Jacobs’ HSE requirements subject to contracting arrangements and regulatory needs. Where specified by contract or as required, the review and acceptance of HSE plans for projects are completed between the Contractor companies and Jacobs. HSE Management Roles in the BMS clearly define roles and responsibilities and how safety is managed, documented, and reported according to various parties involved. As detailed in the BMS, Jacobs may contract to exercise certain HSE management roles regarding Jacobs’ managed contractors and may monitor the contractor’s HSE performance to achieve contractual obligations. Hazard and Impact Identification, Risk Assessment, and Incident Management Potential hazards and impacts are identified and documented for all levels of work, including operations, products, business developments, acquisitions, modifications, and projects. Hazards and impacts are analyzed through formal risk assessments to determine the specific risk event resulting in the highest potential severity rating, potential causes, impacts types, preventative controls, and mitigating controls. Control measures, including critical controls, are identified and prioritized according to the hierarchy of controls, and implemented to effectively control risks. A material risk is a risk with the severity that could affect the viability of the business. The opportunity to prevent material impact on the business starts with Material Risk Management. Jacobs has a designated Enterprise Risk Management team that controls the process for managing risk. that has developed a global framework for managing risk. The framework is in alignment with ISO31000- Risk Management. Jacobs’ Risk Register is maintained by the Risk team from the outcomes of functional risk assessments. Project Risk Registers, as required, are reviewed at predetermined levels in conjunction with Material Risk, Major Hazard, and Critical Control owners, or otherwise following a significant change or Significant Potential Incident, to reflect learnings to improve the risk controls. HSE risk management is defined in the Jacobs HSE Risk Management procedure, which provides minimum requirements for assessing risks, specifying and implementing control measures, communicating risks, and monitoring the effectiveness or risk controls for facilities and projects. Operational management plans, systems and procedures are established, implemented and maintained to manage identified HSE risks. We have processes in place to verify the effectiveness of controls and identify improvement opportunities during the hazard and impact identification and risk assessment process and updated where required. Hazard/impact identification and risk assessment is applied across all levels of work and completed by competent persons. At the activity level, Jacobs utilizes a Safe System of Work approach which is a fit for purpose plan or procedure that identifies all potential hazards/impacts and control measures or safe work methods necessary to minimize risk. Supporting a Safe System of Work may include Safe Work Method Statements, Job Safety and Environment Analysis, and task level hazard/impact assessments using our StepBack process. Jacobs’ BeyondZero Observations is a process utilized by all employees to intervene and report on work behaviors and conditions inclusive of all HSE risks and opportunities. The process includes response, notification and action management. All workers are empowered to Stop Work. Jacobs has an established procedure that provides the framework for our Stop Work process--each employee has the authority, and understands the expectation,
FY21 ESG Disclosures July 2022 Unaudited 45 to Stop Work if they believe that there is uncontrolled risk to themselves, others, the environment, or the community. Jacobs has integrated procedures and processes for managing health and safety, environmental, motor vehicle and security-related incidents. Requirements and responsibilities for the following elements are specified in HSE and Security Incident Management procedures. Incident Response, which includes emergency actions, coordination with local authorities, and site control actions. Notification, which includes immediate verbal notification to supervisor, and timely notification of management, clients, government authorities, and other groups as necessary depending on the nature of the incident. Reporting, which includes written reports, data entry to Intelex along with preliminary hazard classification to initiate automated workflows. Investigation and Analysis of work-related injuries, ill health, diseases and incidents , which includes, through the use of established processes and suitably competent persons, gaining an understating of what happened, why the incident occurred and what actions can be identified to prevent it from happening again. Communication, which includes communication of the incident and analysis findings to site personnel. Records, which includes written reports and inclusion of incident information and actions in the Intelex information management system. Occupational Health Services Jacobs has specialized occupational health service providers and internal specialists to aid in the identification of occupational health hazards and ongoing risk management where applicable. Competency requirements are completed in accordance with Jacobs’ Competency Framework within operations, along with identification of core HSE competencies, maintenance of a competency needs assessment, assessment and verification of competency, and maintenance of competency records. Service providers are assessed through Jacobs’ procurement management processes and are required to achieve the standards and licensing/permit requirements applicable to them in the jurisdiction where they operate. We maintain personal health related information in accordance with Jacobs’ privacy and records management policies and legislated requirements for the jurisdiction where we operate, for example, the Health Insurance Portability and Accountability Act of 1996 (HIPAA). Emergency Procedures and Plans The integration of actions to prepare for and respond to emergency situations is managed via our Global Resilience program. This process establishes companywide emergency management requirements including Crisis Management, Business Continuity, and formation of Emergency Response and Management Teams. Jacobs’ locations and project sites prepare emergency response plans for potential site emergencies such as medical emergencies, fires, spills, extreme weather, personal security threats and similar credible events. These plans are typically included as part of the project or office plans, inclusive of health and safety, environment, and security plans for the location and include emergency management information based on the assessed risks at site. Training to support Jacobs’ Emergency Management and Business Continuity commences with our onboarding program and continues with awareness training available for all employees and required courses for HSE and emergency and crisis management teams. It extends to local drills, annual scenario
FY21 ESG Disclosures July 2022 Unaudited 46 testing and bespoke crisis training for regional and global crisis management teams, progressing competency and capability. The business utilizes mass communications technologies to support a global response. Worker HSE Training Essential and appropriate HSE training and awareness is provided to workers at all levels. Training needs analysis is completed at relevant levels of the organization to establish competency requirements. This is done via Jacobs’ HSE training categories which set out the minimum required HSE training for all Jacobs employees, and ensure they receive the appropriate HSE training for the role they undertake. All new Jacobs employees must complete the Jacobs’ On-Boarding process which has four steps. This overall process was created taking into consideration legal requirements across the globe in generating best practice compliance globally for HSE onboarding and is mandatory to ensure Jacobs is meeting its HSE Duty of Care. Step 1: Pre-hire induction to specify key HSE programs and risk management approaches. Completed by all new hired employees. Step 2: All workers complete online Global On-Boarding Module within the first week of employment. Step 3: Mandatory that all workers complete Jacobs’ global HSE culture training program. Step 4: Ongoing training needs, as well as training on specific work-related hazards, impacts, hazardous activities, or hazardous situations, is completed at the operational level as per HSE training categories. HSE training for all employees occurs on a regular basis with consideration to risk management, compliance and competency needs. Promotion of Worker Health and Wellbeing Advancing the health, wellbeing, and safety of society is one of our Sustainable Business Objectives supporting our global sustainability strategy, PlanBeyond 2.0. At Jacobs, we believe that health awareness and support go beyond just the workplace. Supporting our employees and other stakeholders at work, at home and in the community can make a positive difference, and our Jacobs’ global wellbeing strategy delivers an integrated approach that encompasses physical, emotional, financial, social, and workplace wellbeing for all Jacobs employees and their families. Jacobs provides a range of employee benefits that support non-occupational health, including a comprehensive Employee Assistance Program, Wellbeing Program access, gym memberships, flu vaccination programs, health insurances, and local health and wellbeing activities. We believe positive mental health is a vital component of a safe, productive, and engaged workforce. Our Mental Health Matters strategy is designed to raise awareness and normalize conversations around mental health issues and provide training and a network to support one another. We actively support the positive mental health of our people and our communities with a global program to: Provide every location with the appropriate trained resources to implement the Mental Health Matters strategy. Empower every location to build their positive mental health champions network and eliminate the stigma of mental health so that is becomes an integral part of our Culture of Caring. As part of the program, we provide Positive Mental Health Champions, training our employees in how to guide staff who have mental health concerns or crises to the appropriate level of help; support fellow employees; and encourage positive mental health throughout the workplace. Jacobs also utilizes its BeyondZero Observation application as part of our continuous improvement efforts to monitor the performance of our mental health programs and to effectively evaluate, monitor, and understand the impact of our mental health programs and overall mental health in the workplace.
FY21 ESG Disclosures July 2022 Unaudited 47 By using the BeyondZero Observation application and selecting Mental Health, Jacobs employees can engage with us on all our mental health programs—both what we’re doing well and where they see opportunities for improvement. Employees can select the relevant topic(s), without divulging detailed information. The Mental Health BeyondZero Observation provides an easy way for employees to provide quantitative feedback on the matters that impact their mental health, from One Million Lives and working from home, to our Positive Mental Health Champions, organizational changes, and much more. In FY19, we established a target to improve the mental health and wellbeing of One Million Lives by 2025. This is not only supported by Jacobs’ global wellbeing strategy, but also through our One Million Lives campaign. Through our free mental health check-in tool, One Million Lives (OML), any person in the world can access mental health resources such as how to guides, conversation starters, useful contact numbers, and FAQs. Jacobs actively encourages employees to use the tool and to share these resources with their family, extended family, co-workers, and community members. We maintain personal health related information in accordance with Jacobs’ privacy and records management policies and legislated requirements for the jurisdiction where Jacobs operates, for example, HIPAA. Assurance, Governance and Evaluation of Progress Effective management of HSE risks and issues is assured via the following elements: Establishment of a global BeyondZero Steering Committee to assist the Executive Leadership Team in relation to Jacobs’ HSE management activities, including: - Ensure the appropriate global HSE policies, procedures and activities are in place such that we meet our general legal obligations - Ensure the appropriate global HSE policies, procedures and activities are in place to effectively mitigate our risks - Ensure appropriate global HSE policies procedures and systems are in place to effectively manage, measure and improve HSE performance - Oversee the provision by Jacobs of a healthy, safe and secure working environment and culture for all employees, contractors, clients and other visitors to our controlled work locations Prioritization and action plans with quantified targets for business unit managers Discussion of HSE issues and risks documentation between HR and managers' BU on a regular basis, and between HSE department and the executive management/board of directors on at least a quarterly basis Evaluation of progress in reducing and preventing HSE issues and risks against targets Internal inspections and consultations by HSE specialists Independent external verification of HSE programs for locations certified to ISO45001, ISO14001 and OHSAS18001 Targets embedded in performance appraisal Internal Inspections Internal inspections are integrated into Jacobs’ HSE risk management and operational control processes to verify the effectiveness of controls and identify improvement opportunities. Operational management plans outline inspection and monitoring requirements, as do Safe Systems of Work at the activity level. Inspections in the form of ongoing monitoring occur through Jacobs’ BeyondZero Observations. This is a process used by all employees to intervene and report on work behaviors and conditions inclusive of all HSE and Security risks and opportunities. The process includes response, notification and action management.
FY21 ESG Disclosures July 2022 Unaudited 48 HSE Auditing Auditing is a key component in verifying Jacobs’ HSE program implementation across the company and identifying areas for improvement. Audit schedules are developed by organizational HSE leads (for example, BU, regions, and global performance units) and approved by LOB HSE leads. Audit schedules are developed based on factors such as risk, negative trends, and accreditation requirements. Audit program implementation including selection of projects, auditor assignments, auditor training, and recordkeeping is defined in Jacobs’ HSE Audit Schedule procedure. Additional audit requirements based on geography, project type, client requirements and similar factors are included in LOB/BU and program, project, or office-specific HSE processes as needed. Management Review HSE performance is reviewed on a regular basis within the LOB/BU and other organizational groups. HSE performance is reviewed at least annually at the global and LOB level as detailed in Jacobs’ Management Review procedure. Management reviews for other organizational groups are performed to determine that the HSE Program is suitable, adequate, and effective. Identified corrective actions or improvements are facilitated by group leadership and the supporting HSE lead as detailed in Jacobs’ HSE Performance procedure. SOC.13 HSE – Products and Services Jacobs does not offer consumer products; we principally provide services and solutions to our clients. HSE in Design Jacobs undertakes a vast range of design services whereby our designers understand the risks associated with the lifecycle of the asset and how design decisions can influence how assets are built, operated, maintained and demolished. By considering the whole lifecycle of a project our designers can not only improve the HSE benefits of a design, but also improve the health and wellbeing of workers, and reduce potential environmental impacts, with greater efficiency of construction, operation and maintenance, leading to reductions in program length and cost savings. De5ign is Jacobs’ behavioral program driving a cultural shift in HSE in Design, which takes Jacobs beyond base legislative requirements to provide a consistent approach to HSE in design across our global business, maximizing HSE benefits across the lifecycle of our projects. De5ign is inclusive of the process to identify and record the risks, use hazard identification/elimination and risk reduction assessments, design hazard lists and red, amber, green lists, and to take residual risks as low as reasonably practicable by consulting with all parties involved. De5ign supports Jacobs’ design professionals by providing an HSE in-design toolset and integrated training. The framework is scalable in application, ranging from small streetscape design services to advanced research and development and technology industry facilities solutions. De5ign supports and leverages Jacobs’ key BeyondZero and PlanBeyond strategies. Employees at all levels are encouraged to challenge unsafe design and speak up when they need support. Our BeyondZero Observation system is used to collect and share learning and HSE in design best practices. Our HSE in Design reviews with HSE professionals drive tangible improvement to all aspects of HSE including wellbeing, occupational and mental health. HSE in De5ign is integrated with our approach to digital solutions, innovation, and technology to generate high value solutions for our clients and customers.
FY21 ESG Disclosures July 2022 Unaudited 49 SOC.14 Health and Safety – Metrics Fatalities In FY21 we continued to demonstrate safety excellence with another year of zero employee or contractor fatalities at work. Table 27. Fatalities Metric Unit FY18 FY19 FY20 FY21 Employee Fatalities Number of fatalities 0 0 0 0 Contractor Fatalities Number of fatalities 1 1 0 0 Total Recordable Incident Rates Employees The following table summarizes our Total Recordable Incident Rates (TRIR) based on OSHA recordkeeping requirements for our employees. Table 28. Total Recordable Incident Rates Metric Unit FY18 FY19 FY20 FY21 TRIR - Employees n/million hours worked 0.97 1.00 0.87 1.07 n/200,000 hours worked 0.19 0.20 0.17 0.21 Data coverage percentage of Operations 100% 100% 100% 100% Notes: / = divided by n = number Contractors The following table summarizes our TRIR based on OSHA recordkeeping requirements for our contractors. Table 29. Contractor Total Recordable Incident Rates Metric Unit FY18 FY19 FY20 FY21 TRIR – Contractors [a] n/million hours worked 1.90 1.92 1.73 1.75 n/200,000 hours worked 0.38 0.38 0.35 0.35 Data coverage percentage of Operations 100% 100% 100% 100% [a] Contractor hours worked are estimated due to variation in reporting methods and frequency across our global contractor population. We are working to enhance procedures to improve data collection. Lost-Time Injury Frequency Rates Employees The following table summarizes our lost-time injury frequency rate (LTIFR) for our employees. Table 30. Lost-time Injury Frequency Rate Metric Unit FY18 FY19 FY20 FY21 LTIFR - Employees n/million hours worked 0.19 0.24 0.40 0.25 n/200,000 hours worked 0.04 0.05 0.08 0.05 Data coverage percentage of Operations 100% 100% 100% 100%
FY21 ESG Disclosures July 2022 Unaudited 50 Contractors The following table summarizes our lost-time injury frequency rate (LTIFR) for our contractors. Table 31. Contractor Lost-time Injury Frequency Rate Metric Unit FY18 FY19 FY20 FY21 LTIFR – Contractors [a] n/million hours worked 0.52 0.57 0.46 0.39 n/200,000 hours worked 0.10 0.11 0.09 0.08 Data coverage percentage of Operations 100% 100% 100% 100% [a] Contractor hours worked are estimated due to variation in reporting methods and frequency across our global contractor population. We are working to enhance procedures to improve data collection. Occupational Illness Frequency Rate The following table summarizes our occupational illness frequency rate (OIFR) for our employees. Table 32. Occupational Illness Frequency Rate Metric Unit FY18 FY19 FY20 FY21 OIFR - Employees n/million hours worked 0.01 0.07 0.05 0.09 n/200,000 hours worked 0.003 0.01 0.01 0.02 Data coverage percentage of Operations 100% 100% 100% 100% Absentee Rate The following table summarizes our employee absentee rate for non-U.S. employees based on available data. The wellbeing of our people is of highest priority, and we will continue to invest in programs and practices to support our global workforce; refer to SOC.7 Employee Wellbeing and Support Programs for more detail. Table 33. Absentee Rate (Non-US Only) Metric FY21 Absentee Rate – Employees [a] 2.4% Data Coverage [b] 41% [a] Absentee rate reflects unplanned days off as a percentage of total days scheduled to be worked. Rate is based on Jacobs employee sick leave data, reflecting time lost due to unplanned time away from work such as individual leave taken for minor illness or injury. Does not include scheduled or permitted days off such as for holidays or parental leave. [b] Data coverage reflects percentage of Jacobs employees included in our FY21 absentee rate calculation. Due to timekeeping structures and data limitations, data coverage reflects non-U.S. employees only. We are working to continually improve our ability to capture and disclose this information at the global level. SOC.15 Client Satisfaction Consistent with our company value, “We Aim Higher,” we’re always looking beyond to raise the bar and deliver with excellence—bringing our clients innovative solutions that lead to profitable growth and shared success. Periodic feedback on our performance is an integral part of successful delivery. This feedback process starts at project outset with our Client Expectations Survey, and we consider all engagements throughout project lifecycle contributory to our relationships and overall client satisfaction. For reporting purposes, we measure client satisfaction through two primary mechanisms: Client Satisfaction Surveys (CSS) and the U.S. Federal Contractor Performance Assessment Reporting System (CPARS) for U.S. federal clients. Periodic assessment of this information enables us to evaluate performance, identify trends and adjust practices for continual improvement.
FY21 ESG Disclosures July 2022 Unaudited 51 Table 34. Client Satisfaction Rate Metric FY21 Client satisfaction rate 94.5%* *Satisfaction rate based on available data. Excludes CMS-US business. Includes CPARS ”would recommend” and CSS ”meets/exceeds expectations” ratings. Some clients surveyed more than once across different contracts and scopes of work.
FY21 ESG Disclosures July 2022 Unaudited 52 GOVERNANCE GOV.1 Values, Ethics and Code of Conduct Our values are publicly available on our website: We do things right. We always act with integrity – taking responsibility for our work, caring for our people and staying focused on safety and sustainability. We make investments in our clients, people and communities, so we can grow together. We challenge the accepted. We know that to create a better future, we must ask the difficult questions. We always stay curious and are not afraid to try new things. We aim higher. We do not settle – always looking beyond to raise the bar and deliver with excellence. We are committed to our clients by bringing innovative solutions that lead to profitable growth and shared success. We live inclusion. We put people at the heart of our business. We have an unparalleled focus on inclusion with a diverse team of visionaries, thinkers and doers. We embrace all perspectives, collaborating to make a positive impact. The Company has a publicly-available Code of Conduct for our employees , Board of Directors , CEO and senior financial officers, and a publicly-available Supplier Code of Conduct for our suppliers and other business partners . Our Code of Conduct addresses various topics, including, but not limited to: Corruption and bribery Human rights, discrimination, inclusion and diversity Confidentiality of information Conflicts of interest and business ethics Antitrust/anti-competitive practices Money-laundering and insider trading/dealing HSE Whistleblowing Quality In FY21, 99% of our employees completed our online Code of Conduct training, which included a written acknowledgment of compliance and completion. The Company sustains its culture by remaining true to its purpose and values. This means promoting inclusion, celebrating diversity, and approaching everything with acceptance and respect. The Company is committed to ensuring the education of its employees on these important topics and principles, and our No Harassment, Discrimination, Bullying and Violence Policy encourages or requires employees and managers to report concerns or complaints in order to prevent harassment, discrimination, bullying, and violence in the workplace or which has an effect upon the workplace. Our Human Rights Policy further reinforces our commitment to a workplace free of harassment and discrimination and is guided by international principles including those encompassed in the U.N. Guiding Principles on Business and Human Rights, Universal Declaration of Human Rights, International Bill of Rights, and the International Labor Organization’s Declaration on Fundamental Principles and Rights at Work. The Jacobs Integrity Hotline is available to employees and others who wish to report non-compliance or suspected violations of law and policy, or to seek guidance on specific situations regarding company policy. The Integrity Hotline is available 24 hours a day, 7 days a week. Reports may be made anonymously at integrity.jacobs.com or at telephone number +1.844.543.8351. Shareholders, employees and interested parties can also communicate directly with Jacobs’ Lead Independent Director or Chair of the Audit Committee. Jacobs strictly prohibits any form of retaliation against individuals who make a report in good faith out of genuine concern. The Audit Committee receives regular briefings from the legal
FY21 ESG Disclosures July 2022 Unaudited 53 department and internal audit regarding hotline reports (to the extent not reported to another committee). More information can be found on our website here: Ethics & Conduct . GOV.2 Supply Chain Jacobs operates in 40 countries and engages more than 20,000 suppliers worldwide. We have a publicly-available Supplier Code of Conduct , which we have updated for FY22. When registering within our global supplier system, suppliers must certify their agreement to our Supplier Code of Conduct. The Supplier Code of Contact covers various topics, including, but not limited to: HSE Sustainability Quality Competition and anti-trust Bribery and corruption Inclusion and diversity Human rights Business ethics Jacobs’ Supply Management is focused on ensuring project delivery, reducing overall performance and supply chain risk, and building strategic relationships with our suppliers to help drive savings and meet our key initiatives, including sustainability, human rights and diversity. During supplier qualification, we gather data on financials, HSE, quality and technical capability. This process is detailed in internal policies. Our Legal Ethics & Compliance department has a process for identifying bribery and corruption risks for suppliers and other third parties. Factors include the Corruption Perception Index (CPI) score, debarment list screening, desktop media searches, affiliation with Government entities/officials, and years in business. The assessment is conducted via a third-party background screening software, which uses external data points from sanctions lists and public news sources. Indicators of interaction/affiliation with Government entities/officials result in a high-risk classification. High risk suppliers undergo heightened due diligence, including the completion of questionnaires, commissioning of in-depth background reports, and evaluation of any additional red flags. We also assess suppliers via a human rights qualification questionnaire and certification process. As outlined in our Climate Action Plan , our Supply Chain Management and Procurement teams will establish climate action goals for major suppliers, and partner with our suppliers to improve Scope 3 data and target reductions. Through our Science-Based Targets we have committed that 65% of our suppliers by spend covering purchased goods and services will have science based targets by 2025. In January 2021, we made a three-year commitment to CDP as a supply chain member to engage our suppliers, pinpoint risks and identify opportunities to support our suppliers in reducing emissions and strengthening their climate resiliency. Jacobs was recognized on CDP’s 2021 Supplier Engagement Leaderboard for engaging our suppliers on climate change and playing a crucial role in the transition towards the net-zero sustainable economy. GOV.3 Board Structure Jacobs maintains information on Corporate Governance, including information on our Board, on our Investors’ website invest.jacobs.com . Also, refer to our 2022 Proxy Statement for details on our governance structure. The Board’s leadership is comprised of Chair of the Board and CEO, Steven J. Demetriou, and Lead Independent Director, Christopher M.T. Thompson. The Board has determined that having Mr. Demetriou serve as Chair of the Board provides significant advantages to the Board and the Company, as it allows the Board to benefit from his knowledge of the Company’s business and market opportunities and risks, and
FY21 ESG Disclosures July 2022 Unaudited 54 also facilitates communications and relations with other members of senior leadership. The Board also believes that having Mr. Demetriou serve as Chair of the Board is advantageous to the Company when working with clients in certain areas of the world in which the title of Chair is significant. Because the Jacobs Board believes that strong independent leadership is a critical aspect of effective corporate governance, the Board has established the position of Lead Independent Director. The Board believes that a Lead Independent Director, who has the responsibilities set forth in the Company’s Corporate Governance Guidelines, provides independent leadership, oversight and benefits for the Company and Board that would be provided by an independent Chair. The current standing committees of the Board are Audit, ESG and Risk, Human Resource and Compensation, and Nominating and Corporate Governance. The members of these committees consist only of independent directors. The Board may form and disband new temporary or permanent committees as it deems appropriate, depending upon circumstances from time to time. GOV.4 Board Composition and Diversity Effective January 25, 2022, the Board consists of 10 directors. In addition to our Chair of the Board and CEO, the Board is comprised of 9 independent directors. Although the role of our Chair of the Board and CEO is combined, a Lead Independent Director has also been appointed. Our definition of “independent” is detailed under “Guidelines for Determining Director Independence,” on page 2 of Jacobs Corporate Governance Guidelines . The definition provides that it is expected that Board members (in that role) will exercise diligently and in good faith their independent judgment in the best interests of the Company and its shareholders as a whole, notwithstanding their other activities or affiliations. No director qualifies as “independent” unless the Board affirmatively determines that the director has no material relationship with the Company (either directly or as a partner, shareholder, or officer of an organization that has a relationship with the Company). The representation of board members who are ethnically diverse or female is 50%. Of our 10 directors, 3 are female and 4 are racially and ethnically diverse. 50% of our directors are new since 2019. Additionally, our Corporate Governance Guidelines expressly require that diversity factors, such as gender, race, ethnicity, country of origin, nationality, or cultural background be considered in the board nomination process. As stated in our 2022 Proxy Statement under “Board Composition”, the Board believes it should encompass individuals with diverse backgrounds and perspectives. In accordance with these Guidelines, the Nominating and Corporate Governance Committee considers the diversity of viewpoints, backgrounds, experiences and other demographics in evaluating and considering potential director candidates. Diversity is an important consideration in the director nomination process because the Board believes that people of broad diversity including, but not limited to, different genders, experiences, ages, races and ethnic backgrounds and military experience can contribute different, useful perspectives while collaborating effectively to further the Company’s mission. GOV.5 Board Nominations and Conflict of Interest Once potential director candidates are identified, including any candidates nominated by shareholders, the Chair of the Nominating and Corporate Governance Committee, the Lead Independent Director and the Chair of the Board and CEO shall review the backgrounds of those candidates with the Nominating and Corporate Governance Committee. The Nominating and Corporate Governance Committee is then responsible for recommending a selection of director nominees to the Board. It is the Board’s responsibility to nominate and, in certain circumstances (such as to fill vacancies that may occur on the Board), to elect directors in consultation with the Nominating and Corporate Governance Committee. Directors are expected to avoid any action, position or interest that conflicts with the interests of the Company or gives the appearance of a conflict of interest. If an actual or potential conflict of interest develops because of a change in the business operations of the Company, or in a director’s circumstances,
FY21 ESG Disclosures July 2022 Unaudited 55 the director is required to report the matter immediately to the Chair of the Nominating and Corporate Governance Committee and the Chair of the Audit Committee. If a director has a personal interest in a matter before the Board, the director shall disclose the interest to the full Board and excuse herself or himself from participation in the discussion and shall not vote on the matter. GOV.6 Board Roles and Effectiveness The primary responsibilities of the Board are oversight, counseling and direction to the management of the Company in the interest and for the benefit of the Company and its shareholders and other stakeholders. The Board has delegated to the executive officers of the Company the authority and responsibility for managing the business of the Company in a manner consistent with the standards and practices of the Company in compliance with applicable law, and in accordance with any specific plans, instructions, or directions of the Board. The Board oversees the Company’s approach to enterprise risk management (ERM), designed to support the achievement of strategic objectives, improve organizational performance, and enhance long-term shareholder value. In conjunction with management, the Board assesses the specific risks faced by the Company and reviews the steps taken by the Company’s leadership to manage those risks. The Board also provides guidance to and oversight of management throughout the year with respect to setting the Company’s corporate strategy, which facilitates these assessments and reviews. The Board also encourages management to promote a corporate culture that integrates risk management into the Company’s corporate strategy and day-to-day business operations in a way that is consistent with the Company’s targeted risk profile. Pursuant to the Board’s instruction, the Company’s leadership regularly reports on applicable risks to the relevant Committee or the Board, as appropriate, including regular reports on significant Company projects, with additional review or reporting on risks being conducted as needed or as requested by the Board and its Committees. In FY20, as part of the Company’s ongoing evaluation of its ERM program, the Company undertook various actions to further enhance the effectiveness of the program, including the following: Created a new senior management position to oversee the Company’s ERM program. This officer provides regular reports to the Board. Engaged third party ERM expert to provide an independent assessment of the Company’s risks, policies and procedures. Increased reporting to and feedback from the Board, including a designated Board sponsor. In FY21, the new ESG & Risk Committee was formed to further increase oversight of ESG and ERM. Overall director attendance at meetings of the Board and its Committees was 100% during FY21. Board members are expected to attend annual meetings of shareholders. All the members of the Board attended our 2021 Annual Meeting of Shareholders via the virtual meeting platform. GOV.7 Remuneration Detailed information on our remuneration policies and process for our named executive officers and members of the Board can be found in our 2022 Proxy Statement (pp. 31–61). The following table shows the total compensation of our CEO, the total compensation of our median employee, and the ratio of our CEO’s total compensation to that of our median employee in FY20 and FY21. Table 35. Compensation Compensation (USD) FY20 FY21 % Change CEO Base Salary $1,365,000 $1,365,000 0.0% increase CEO Total Annual Compensation $14,814,906 $16,275,230 9.6% Increase Median Employee Total Annual Compensation $86,427 $91,393 5.7% Increase Ratio of CEO to Median Employee Total Annual Compensation 171 to 1 178 to 1 N/A
FY21 ESG Disclosures July 2022 Unaudited 56 GOV.8 Management Incentives (Non-Financial Metrics) In FY19, the Company introduced an individual strategic, non-financial modifier for the overall Leadership Performance Plan payout for the Named Executive Officers (NEOs) and the other senior executives to provide incentives and drive accountability for Company initiatives that drive long-term stockholder value. In FY21, the modifier was changed to a stand-alone metric for the strategic non-financial initiatives and was included in the incentive funding for all vice presidents and above participating in the program. Such initiatives include inclusion and diversity, sustainability, improvements in talent retention, driving innovation across the business, safety and operational excellence, and cultural initiatives, of which each executive selected two. The individual, strategic, non-financial modifier has a total weighting of 10%, with maximum funding of 200% of the weighted amount, based on the Compensation Committee’s assessment of the executive’s performance and the impact on the organization of the executive’s achievement on the assigned goals. For FY21, the Compensation Committee reviewed and approved the strategic goals for the CEO, and the CEO approved the strategic goals for the other NEOs after consultation with the Compensation Committee. Additional detail, including the strategic non-financial goals for each NEO, can be found in the 2022 Proxy Statement (p. 39–40). GOV.9 Materiality Assessment and Sustainability Strategy We conduct periodic materiality assessments to identify and prioritize the topics on which we should focus our strategies and reporting. Our approach considers issues that represent Jacobs’ significant environmental, social, governance and economic impacts; our ability to drive long-term value creation and what is important to internal and external stakeholders. The results of these assessments enable us to continually upgrade our business for the future. Materiality Assessment: 2018 and 2021 We conducted our first global materiality assessment in 2018, which served as a foundation for our inaugural PlanBeyond sustainability strategy. We updated our materiality assessment in 2021, informed by extensive research and engagement with a range of stakeholders about the sustainability risks, opportunities and impacts most significant to our organization. As part of this process, we identified a list of sustainability issues that are relevant to our industry, business and impacts on people and planet and invited formal feedback on the significance and priority of these topics. This included a global employee survey, to which we received 12,000 responses, representing 24% of our total workforce. We also interviewed our company leaders and Board to understand their view on Jacobs’ business risks, opportunities, impacts and emerging issues. Additionally, we engaged key external stakeholders to understand their priorities and where they consider Jacobs is best positioned to create positive impact. This outreach included interviews and dialogue with a wide range of clients, suppliers, peers, investors, industry organizations and community partners across geographies and sectors. To inform our approach and validate priorities, we also incorporated global and industry trend analysis, regulatory reviews, peer benchmarking, media scans and third-party expertise into the materiality assessment process. Upon developing a prioritized list, we conducted feedback sessions with key internal stakeholders and subject matter experts to review the findings and provide feedback into the next phase of sustainability strategy development. Ultimately, this resulted in the launch of our sustainable business approach, PlanBeyond 2.0 , described below in further detail.
FY21 ESG Disclosures July 2022 Unaudited 57 Materiality Assessment: 2022 We recognize the need to continually review and refine our materiality assessment and priorities— particularly given the pace of change in our world due to the ongoing effects of COVID-19, global reckoning on social justice, and other geopolitical and macroeconomic factors. Considering such external conditions as well as internal developments, we refreshed our materiality assessment in 2022. Grounded in the stakeholder feedback and results from our 2021 materiality assessment, we also considered recent internal and external inputs and significant business advancements in our updated assessment, including our FY22 to FY24 company strategy , enterprise risk management framework, global Culture Survey (refer to section SOC.3 Inclusion and Diversity - Strategy of this document) and Climate Action Plan . This updated assessment resulted in the elevation of topics such as those related to climate response and project impacts, innovation and digitization and human capital. As reflected in our company strategy , the climate crisis and other mega-trends present us with a unique opportunity to drive growth and long-term value creation around climate response, secure data-driven solutions and consulting and advisory services. It is through our broad range of client solutions that we will be able to not only deliver on this business growth opportunity but amplify the scale of Jacobs’ positive impact on the environment and society. As a professional services company, our people are the heart of our business. Attracting, engaging, advancing and retaining top talent is foundational for us to deliver our company purpose to “create a more connected, sustainable world.” Thus, issues related to human capital are high priorities, including health, safety and wellbeing; inclusion and diversity; and talent attraction, development and retention. Materiality Assessment: Priority Issues The topics listed below reflect the results of our 2022 materiality assessment and the issues we continue to prioritize in our business and sustainability strategies, decision making and reporting. While we have listed these topics with an indication of priority from a global perspective, the relative importance may shift based on local and operational context. Figure 2. 2022 Materiality Assessment: Priority Issues
FY21 ESG Disclosures July 2022 Unaudited 58 Sustainability Strategy The outcomes from our stakeholder engagement, materiality assessment and feedback sessions underpinned the development of our PlanBeyond 2.0 sustainable business approach. Aligned with Jacobs’ purpose to create a more connected, sustainable world, PlanBeyond 2.0 represents the next phase of our sustainability journey. It reflects a holistic approach to sustainability across the environmental, social and economic dimensions and is being integrated into our business model and company strategy. Compared to the original PlanBeyond framework launched in 2018, PlanBeyond 2.0 reflects two key advancements: (1) amplifying our focus on integrating sustainability across 100% of our client solutions and (2) more explicitly mapping our approach against the SDGs. We identified six SDGs that are material to our business, where we can have the most influence and impact, in alignment with our 2022 materiality assessment. While we remain committed to contributing towards all 17 SDGs, our core SDGs include: SDG 3: Good Health & Wellbeing SDG 6: Clean Water and Sanitation SDG 9: Industry, Innovation and Infrastructure SDG 10: Reduced Inequalities SDG 11: Sustainable Cities and Communities SDG 13: Climate Action In alignment with these core SDGs, we have developed six Sustainable Business Objectives (SBOs) that are relevant to our business, summarized in Figure 3 below. Each SBO has a headline target and associated sub-targets. The SBOs sit at the heart of our company strategy and define our aspirations around how we can each play a part in creating a sustainable future for all. For more information on these SBO and our strategies to deliver them, see PlanBeyond 2.0 . Figure 3. PlanBeyond 2.0 Sustainable Business Objectives Table 36 summarizes the intersections among our 2022 materiality assessment, priority issues, strategies and performance. Performance metrics are tracked regularly to measure our progress against our strategy and long-term targets. The “Boundary” column refers to the scope of our involvement, influence and impact in each area, both within and beyond our organization.
FY21 ESG Disclosures July 2022 Unaudited 59 Table 36. Jacobs’ Core SDGs, Material Topics, Strategy and Performance UN SDG Aligned Material Topics Strategy & Long-Term Targets (follow links for detail) Performance Indicators & Progress Boundary & Scope of Influence SDG 3: Good Health and Well- Being Health, safety & wellbeing Talent attraction, development & retention Community engagement & giving Project sustainability impacts Human rights PlanBeyond SBO 1 : Advance the health, wellbeing, and safety of society BeyondZero: To 2025 and Beyond strategy Target (PlanBeyond 2.0): Improve the mental health and wellbeing of One Million Lives by 2025 Target (Beyond Zero strategy): By 2025 see significantly reduced work-related harm Total recordable incident rate Lost-time injury frequency rate Occupational illness frequency rate Fatality rate Absentee rate One Million Lives check-ins Employee engagement Charitable giving and volunteering Health market projects and revenue For information on progress, refer to SOC.7 Employee Wellbeing and Support Programs , and SOC.14: Health and Safety – Metrics . Our Culture of Caring ℠ and BeyondZero approach extend beyond the boundaries of our employees and client solutions to positively influencing our friends, families and wider society while generating value to investors and stakeholders. Influence areas span on-site health and safety; mental health and holistic wellbeing across our workforce and society and broad impacts through our health market presence, including providing solutions to governments and healthcare agencies. SDG 6: Clean Water Sanitation Water management Project sustainability impacts Health, safety & wellbeing Community engagement & giving Human rights Inclusion & diversity PlanBeyond SBO 2: Deliver solutions for the global water and sanitation crisis Target: Expand water equity in water- stressed regions through existing and new partnerships by 2025 Water consumption Water equity champions Water market projects and revenue Charitable giving and volunteering Water for People partnership For information on progress, refer to ENV.10: Water Consumption and our FY21 Integrated Annual Report . Clean water and water equity in our project portfolio and community investments impact and create value for our clients, surrounding communities, investors and planet.
FY21 ESG Disclosures July 2022 Unaudited 60 UN SDG Aligned Material Topics Strategy & Long-Term Targets (follow links for detail) Performance Indicators & Progress Boundary & Scope of Influence SDG 9: Industry, Innovation, and Infrastructure Innovation & digital transformation Project sustainability impacts Data security Business continuity & resiliency Business ethics & compliance PlanBeyond SBO 3: Foster a culture of technology and innovation important to the advancement of society 2022-2024 Company Strategy Beyond If : We challenge the accepted Target: Measure impact on 100% of Jacobs’ innovations to advance progress towards the SDGs by 2025 Targets (FY22-FY24 Company Strategy): - 30% revenue from consulting, data and technology solutions and products by end of FY24 - Consulting and Advisory talent base of 10,000 by FY24 end SDG-aligned innovations and digital solutions Consulting, data and technology solutions and products revenue Beginning with FY23, Divergent Solutions business performance For information on progress, refer to FY21 Integrated Annual Report: We Challenge the Accepted. Digital transformation is essential for any business’ growth. Technology and innovation play a pivotal role in today’s global economy and are central to our company strategy and business growth opportunity. Our activity in this area impacts our employees, clients, communities, investors, governments and planet. SDG 10: Reduced Inequalities Inclusion & diversity Recruitment, training & retention Human rights Community engagement & giving Project sustainability impacts Supply chain sustainability Health, safety & wellbeing Business ethics & compliance PlanBeyond SBO 4: Create a fair and inclusive future for all TogetherBeyond : Inclusion and diversity culture Action Plan for Advancing Justice and Equality Collectively: Global giving and volunteering strategy Target (PlanBeyond 2.0): Engage our workforce in 50,000 hours of global STEAM volunteering that enhances diversity and inspires the next generation by 2025 Target : Achieve aspirational goal of 40:40:20 gender diversity by 2025 (40% men, 40% women, 20% any gender) Gender diversity Racial and ethnic diversity Age diversity Veterans People with disability Pay equity and pay gap Employee turnover and hiring Employee engagement Charitable giving and volunteering Supplier diversity For information on progress, refer to sections SOC.2 Employee Engagement through SOC.11 Community Investment . Integrating social value and equity within our company and into the solutions we deliver for clients is a top priority. We aim to reduce inequalities as we promote inclusive work environments and support inclusive economic growth, both internally and externally. Our activity in this area impacts our employees, clients, suppliers, communities and investors.
FY21 ESG Disclosures July 2022 Unaudited 61 UN SDG Aligned Material Topics Strategy & Long-Term Targets (follow links for detail) Performance Indicators & Progress Boundary & Scope of Influence SDG 11: Sustainable Cities and Communities Project sustainability impacts Carbon emissions & energy Innovation & digital transformation Business continuity & resiliency Biodiversity Human rights Water management Effluents & waste PlanBeyond SBO 5 : Develop efficient and resilient solutions that deliver net environmental and societal gain 2022-2024 Company Strategy Target (PlanBeyond 2.0): 100% of Jacobs’ solutions will contribute to progress against the UN SDGs by 2025 Target (Company Strategy): By end of FY24, 100% of client projects will have ESG scope SDG-aligned projects SDG-aligned revenue Employees providing sustainability services Non-financial project impacts (via Value Plus, Evolve) STEAM volunteering For information on progress, refer to ENV.17 Low-Carbon Transition Plan, Products and Services , ENV.18 Environmental Impact in Project Design and Delivery ; and SOC.11 Community Investment . Sustainable design and comprehensive infrastructure, technology and intelligence solutions help us build resilient and sustainable communities around the globe. Sustainable design is factored into all our solutions, affecting clients, communities and investors. Internally, we are transforming our offices to optimize operational efficiencies and bring about sustainable change. SDG 13: Climate Action Climate action Project sustainability impacts Water stewardship Business continuity & resiliency Supply chain sustainability Biodiversity Business ethics & compliance Effluents & waste PlanBeyond SBO 6 : Accelerate solutions that address the climate emergency Climate Action Plan 2022-2024 Company Strategy: Climate Response Accelerator Targets (Climate Action Plan): - Ensure every project becomes a climate response opportunity - Achieve net-zero GHG emissions across the value chain by 2040 - Maintain carbon neutrality status and 100% low-carbon electricity for our operations Approved Science Based Targets GHG emissions (scope 1, 2, 3) GHG intensity Renewable energy Renewable electricity Energy consumption Energy intensity Water consumption Waste Carbon pricing Science-based targets progress Climate response solutions and revenue For information on progress, refer to sections ENV.3 Greenhouse Gas Emissions through ENV.18 Environmental Impact in Project Design and Delivery . Solutions that address climate change are imperative as we work to address the climate emergency. We offer a range of solutions that support clients’ decarbonization targets, benefiting clients, surrounding communities and the planet and society at large. As a company, we have a robust Climate Action Plan and approved science-based reduction targets.
FY21 ESG Disclosures July 2022 Unaudited 62 GOV.10 ESG Governance PlanBeyond ™ is our sustainable business approach, developed based on our materiality assessment (GOV.9 Materiality Assessment and Sustainability Strategy ). There is a dedicated corporate sustainability team leading on implementation of the focus areas and achievement of our sustainability goals, led by our Global Head of Sustainability in our Office of Global Climate Response and ESG. The PlanBeyond Executive Steering Committee is our executive-level body that meets five times a year to agree on our strategy, review progress against commitments, update our plans around ESG risks and opportunities, and provide review and oversight across our disclosures and reporting. The committee is comprised of the Chair & CEO, CFO, COO, Chief Legal & Administrative Officer, Chief People Officer, Chief Strategy & Communications Officer, Chief Digital & Information Officer, President and Senior Vice Presidents of both LOBs, Senior Vice President Strategy & Solutions, Head of ERM, Head of Investor Relations, General Counsel and Corporate Secretary, and Deputy General Counsel and Chief Compliance Officer. Our President and CFO serves as the Executive Level Sponsor for Sustainability. Our SVP of Global Climate Response and ESG is the most senior employee dedicated to ESG and Sustainability. We have identified climate risks and opportunities as one of the company’s top ESG-related risks, and, as such, the Board plays an active role in helping to ensure effective climate risk management. Board oversight of ESG is spread across all Board Committees. The ESG & Risk Committee is responsible for the reviewing and overseeing the Company’s overall ESG strategy, overseeing the Company’s key ESG initiatives and policies and key enterprise-wide ESG metrics, targets, key performance indicators and related goals. The Audit Committee is responsible for oversight of controls and processes over material ESG data reporting and other ESG-related matters delegated from the ESG & Risk Committee. The Human Resource and Compensation Committee is responsible for oversight of human capital management and other ESG-related matters delegated from the ESG & Risk Committee. The Nominating and Corporate Governance Committee is responsible for oversight of ESG-related matters delegated from the ESG & Risk Committee. Additionally, Jacobs has a cross-functional working group on ESG reporting, comprising functional leads that are stakeholders in our carbon reporting and ESG disclosures. This committee includes leaders from Finance, Legal, Internal Audit, and the Office of Global Climate Response & ESG. This group meets monthly to discuss reporting updates, regulatory changes, data quality and external engagement. We have a technical delivery team responsible for creating a roadmap and action plan for delivering the commitments with the Climate Action Plan. This team is composed of technical carbon and climate subject matter experts from our offices around the world. Finally, we created a network of Sustainability Leads across our Business Units to operationalize sustainability and drive strategy and target delivery into each of our LOBs. Figure 4 shows Jacobs’ ESG Governance Structure. Figure 4. ESG Governance Structure
FY21 ESG Disclosures July 2022 Unaudited 63 GOV.11 Risk Governance Our Executive Vice President (EVP), ERM is tasked with dedicated risk management responsibility, reporting to our EVP and Chief Legal and Administrative Officer. Our President and COO is tasked with responsibility for monitoring and auditing risk management performance on an operational level, reporting to our Chair of the Board and CEO. The Board oversees the Company’s approach to ERM, which is designed to support the achievement of strategic objectives, improve organizational performance and enhance long-term shareholder value. In conjunction with management, the Board assesses the specific risks faced by the Company and reviews the steps taken by the Company’s leadership to manage those risks. The Board also provides guidance to and oversight of management throughout the year with respect to setting the Company’s corporate strategy, which facilitates these assessments and reviews. The Board also encourages management to promote a corporate culture that integrates risk management into the Company’s corporate strategy and day-to-day business operations in a way that is consistent with the Company’s targeted risk profile. In FY21, the Board formed a new standing committee, the ESG & Risk Committee, to further enhance the structure of the Board’s oversight for ESG and ERM. The ESG & Risk Committee assists the Board in overall oversight of ESG and ERM matters, with certain specified areas being allocated to the Board’s other standing committees. To ensure coordination and collaboration among the Board’s committees, the membership of the ESG & Risk Committee includes members from each of the Board’s committees. Additional discussion of the Board’s role in ERM oversight can be found in the 2022 Proxy Statement , including risk oversight for each committee, on pp. 14–16. A Global Enterprise Risk Steering Committee, chaired by our EVP for ERM, oversees and works with teams working on priority areas (for example, ESG, Cyber and Projects) and defines and updates as necessary, risk appetite and risk policies. Key ESG risk and opportunity areas include, but are not limited to, climate, supply chain, inclusion and diversity, health and safety, and talent attraction, retention and development. Our FY21 Form 10-K contains a discussion of some of the risks and uncertainties that could have a material adverse effect on the Company (pp. 21–46). As detailed further in the Climate Change section of this document ( ENV.15 Climate Change ), our first global climate risk assessment was completed in March 2020. We applied the TCFD framework to identify climate risks that are material to our business, including those arising from both physical and transitional risks. Potential risks include project failure, operational and supply chain disruption, being outpaced by competitors, and business fragmentation. Our opportunity analysis indicates that we are well-placed to take advantage of low and zero carbon transition and help our clients create smart, resilient cities and infrastructure. Our Global Security & Resilience (GS&R) program provides integrated assurance from its subject matter experts to identify, react and adapt to disruption. It sets the standards and framework to ensure designation, responsibility, competence and tools for anticipation, evaluation, preparation, response, and management of emergency incidents and crisis events, based on the Incident Command System, a standard emergency response model used internationally. Our business resilience program safeguards the protection of our people, environment, assets, and reputation, as well as enabling the continuation of business services to endure and succeed. Emerging Risks Two emerging risks that may have long-term impact on the business are summarized in Table 37. Both risks are included in our Enterprise Risk Management (ERM) framework and are the subject of regular review and discussion in Jacobs’ risk governance processes, including Board oversight and engagement.
FY21 ESG Disclosures July 2022 Unaudited 64 Table 37. Emerging Risks Technological risk related to transitional climate change impacts Financial risks and opportunities related to shifting geopolitics Description Our FY22 Climate Risk Assessment highlighted the potential for technological risks under two future climate scenarios: a rapid and orderly transition, and a delayed and disorderly transition to a net-zero future. Technology will play a key part in enabling the transition to net zero, and Jacobs is investing in developing climate-related digital products and solutions that will further our own climate mitigation and adaptation initiatives and those of our clients. As governments and businesses collectively transition to net zero, there is uncertainty over which technologies and products will prove to be most effective in supporting local, national and global transitions. As Jacobs anticipates significant overall company growth to come from climate response-related solutions, the evolving landscape of what the world needs, along with the innovations and technologies that are best positioned to meet those needs, presents both a business risk and opportunity. Jacobs’ growth in recent decades has benefited from globalization and the enhanced movement of talent, resources, ideas and technologies. We also operate as a globally connected organization, with geographically diverse, widely distributed teams delivering work around the world. Deglobalization and regionalization shifts in the economic and geopolitical environment triggered by post-pandemic national economic recovery efforts and the war in Ukraine may adversely affect our people, operations and clients’ demands for our services and solutions, such as through nearer-term delay or abandonment of ongoing or anticipated projects due to potential shifts in our clients’ priorities and budgets, and longer-term increased nationalization trends in procurement. Potential impact Jacobs’ strategy recognizes the significant growth opportunity that our cross-market solutions and capabilities position us for in climate response. Accordingly, the company is investing in people and technologies. However, in the rapidly evolving technological and macroeconomic landscape, this investment has an associated risk of misalignment with client needs. We use our quantified 2050 TCFD scenarios to guide strategic investments, operational decision-making and long-term client engagement. Investment in redundant or dead- end technologies associated with unrealized scenarios could result in material impact to Jacobs. For example, insufficient research on new low-emissions technologies could lead to Jacobs investing in, promoting or advising on inappropriate, ineffective or financially inefficient transition solutions. This could impact our reputation and market share. Regardless of actual transition pathways, reduced (initial) market interest in low carbon transition solutions may exacerbate this risk. Jacobs' globally connected talent force collaborates to deliver solutions for clients, agnostic of geography. This relies upon client procurement models that are open to global professional service provision. Increased nationalization and heightened buy-local policies and regulation could reduce the effectiveness and competitive differentiation enabled by Jacobs' global delivery model and compound the existing talent shortage in key geographies like the United States, United Kingdom, Australia, and New Zealand. This may be offset to some degree by greater opportunities driven by onshoring and reshoring of markets in which Jacobs is a global leader, and supported by skills transferability, strong capability adjacencies in local geographies, and automation innovation. Examples include manufacturing of semiconductors, biopharmaceuticals, electric vehicles and batteries, and emerging “green” technologies.
FY21 ESG Disclosures July 2022 Unaudited 65 Technological risk related to transitional climate change impacts Financial risks and opportunities related to shifting geopolitics Mitigation strategy Our strategy to mitigate this risk includes continuing to partner with our clients, leveraging our relationships and engaging in regular, proactive dialogue to ensure we understand their business, customers and evolving needs. Our FY22 Climate Risk Assessment identifies other risk mitigation measures as part of an adaptive planning process, which include: 1. Conduct early market research on potential technology-related acquisitions and partnerships to expand capabilities and leverage third-party expertise. 2. Develop energy and emissions solutions that are targeted towards particular sector-based climate challenges. 3. Develop our own internal capabilities to apply technology to support our clients’ implementation of sustainable principles and business models—for example, a circular economy. Strengthen multi-capital assessments capability to articulate net zero, social and environmental benefits of sector-based technology and solutions. Several planning and review governance mechanisms enable regular assessment and response to dynamic geopolitical circumstances. Our Global Enterprise Risk Steering Committee, chaired by our EVP for ERM, oversees and works with teams, including the Economic and Geopolitical Risk Team, to evaluate risks, opportunities and potential impacts to end markets, client sectors and operations, among others. We conduct annual and quarterly business planning, which provides a regular governance cycle to review changing E&G circumstances, assess impacts to the business and evaluate response options and priorities. This cycle also includes detailed operations management reviews and planning, including client trends and global talent management. Our company strategy refreshes approximately every 3 years. Generally, this process includes third party-assisted detailed market research based on global trends; comprehensive consultative engagement with Senior Vice Presidents and above regarding challenges, opportunities and priorities within the business and regular updates to the Board during the development process. GOV.12 Corruption Our publicly-available Code of Conduct for our employees , Board of Directors , CEO and senior financial officers, and publicly-available Supplier Code of Conduct for our suppliers and other business partners summarize our anti-bribery and corruption policy. We have a Global Anti-Bribery Policy and anti- competitive related policies, including Gifts and Hospitality, Charitable and Political Contributions, and Due Diligence of Third Parties. These policies set forth specific procedures that must be followed, and criteria and processes that are required, before onboarding a supplier or other Third Party, extending hospitality, etc. We conduct annual Code of Conduct training and periodic training specifically on anti- bribery and corruption and anti-competitive behavior. Additional details can be found in the Values, Ethics and Code of Conduct section of this document. In FY21, 99% of our employees completed our online Code of Conduct training, which included a written acknowledgment of completion. Our FY21 Form 10-K contains a discussion of some of the risks and uncertainties that could have a material adverse effect on the Company, including from corruption. GOV.13 Cybersecurity and Data Privacy Data security is overseen by our Vice President, Cybersecurity, Enterprise Architecture and Quality Assurance, who reports to our Chief Digital & Information Officer. We drive a holistic and integrated protection program inclusive of GS&R and Legal. Our program includes executing to our business management system, which provides clarity and defined accountabilities for risk assessment and management; administrative, technical, regulatory, and procedural requirements and safeguards; periodic
FY21 ESG Disclosures July 2022 Unaudited 66 monitoring, testing and reporting; operational and incident response and reporting; and training and awareness. To validate the effectiveness of our systems at least annually we conduct tests of our business continuity, contingency plans and incident response procedures. We also conduct third-party vulnerability analysis including simulated hacker attacks and conduct our own monthly vulnerability assessments. All employees are required to take annual cybersecurity awareness training. New hires are also required to take cybersecurity awareness training during onboarding. Quarterly phishing campaigns are also conducted with remedial training required for failures to recognize phishing. Policies require all employees to notify Cybersecurity of any suspicious items. We do not release training results or related information on our employees due to the sensitivity and proprietary nature of the information. As part of our cybersecurity governance, we utilize a Cybersecurity Steering Committee comprising executive management, operational leaders and cross-functional teams. Generally, this committee meets quarterly, or as frequently as appropriate, to review, assess and direct decision related to cybersecurity and information systems matters. The Board recognizes the importance of maintaining the trust and confidence of our customers, contractors, partners, and employees. As a part of its objective, independent oversight of the key risks facing the Company, the Board devotes significant time and attention to data and systems protection, including cybersecurity and information security risk. Additional information on the Board’s role in cybersecurity governance can be found in the 2022 Proxy Statement Cybersecurity Governance Highlights (pp. 16–17). Jacobs respects the confidentiality and privacy rights of our customers and is committed to protecting their information. Jacobs does not sell customer information. Jacobs restricts access on a least privilege basis, allowing access only to the information required for job function. Our Privacy Notice explains that we collect and process personal information that a user provides through our services, which may include the user’s name and address, and that we may use this information to communicate with the user and provide the user with requested services. The Privacy Notice provides the user with the ability to contact us regarding data processing questions and data access rights. Jacobs policies, which address the protection, use and disposition of client data, are wholly determined by the Company and are compliant with regulatory and client requirements. The controls, programs, and practices used to secure the data conditionally vary with the categorization and classification of the data along with the project, client and regulatory requirements. Additional information can be found in our privacy policy .
FY21 ESG Disclosures July 2022 Unaudited 67 SUSTAINABILITY ACCOUNTING STANDARDS BOARD (SASB) SASB.1 Professional and Commercial Services (PRO) Table 38. Sustainability Disclosure Topics and Accounting Metrics (PRO) Accounting Metric Category Unit Of Measure Code Data Security Description of approach to identifying and addressing data security risks Discussion and Analysis N/A SV-PS-230a.1 Discussion included in GOV.13 Cybersecurity and Data Privacy Description of policies and practices relating to collection, usage and retention of customer information Discussion and Analysis N/A SV-PS-230a.2 Discussion included in GOV.13 Cybersecurity and Data Privacy (1) Number of data breaches, (2) percentage involving customers' confidential business information (CBI) or personally identifiable information (PII), (3) number of customers affected Quantitative Number, Percentage (%) SV-PS-230a.3 The Company does not disclose this information. Workforce Diversity and Engagement Percentage of gender and racial/ethnic group representation for (1) executive management and (2) all other employees Quantitative Percentage (%) SV-PS-330a.1 Percentages are disclosed in SOC.4 Inclusion and Diversity – Workforce Metrics (1) Voluntary and (2) involuntary turnover rate for employees Quantitative Rate SV-PS-330a.2 Rates are disclosed in SOC.8 Hiring and Retention Employee engagement as a percentage Quantitative Percentage (%) SV-PS-330a.3 Rates are disclosed in SOC.2 Employee Engagement Professional Integrity Description of approach to ensuring professional integrity Discussion and Analysis N/A SV-PS-510a.1 Discussion included in GOV.1 Values, Ethics and Code of Conduct Total amount of monetary losses as a result of legal proceedings associated with professional integrity Quantitative Reporting currency SV-PS-510a.2 The Company does not disclose this information.
FY21 ESG Disclosures July 2022 Unaudited 68 Table 39. Activity Metrics (PRO) Activity Metric Category Unit Of Measure Code Number of employees by: (1) full-time & part- time, (2) temporary, and (3) contract Quantitative Number SV-PS-000.A Numbers disclosed in SOC.4 Inclusion and Diversity – Workforce Metrics Employee hours worked, percentage billable Quantitative Hours, Percentage (%) SV-PS-000.B For FY21, employees worked approximately 96 million hours. For all employees the percentage billable was 82%; excluding corporate employees the percentage billable was 86%. SASB.2 Engineering and Construction Services (E&C) In recognition of Jacobs’ transformation to a technology-enabled solutions provider, MSCI Inc., the leading provider of critical decision support tools and services for the global investment community, changed our Global Industry Classifications Standard (GICS®) code to 20202020 (Research & Consulting Services), effective February 26, 2021. With the change occurring in the middle of the FY21 reporting period, we have elected to disclose to material Engineering & Construction Services metrics in alignment with SASB. Table 40. Sustainability Disclosure Topics and Accounting Metrics (E&C) Accounting Metric Category Unit Of Measure Code Environmental Impacts of Project Development Number of incidents of non-compliance with environmental permits, standards, and regulations Quantitative Number IF-EN-160.a.1 Zero Discussion of processes to assess and manage environmental risks associated with project design, siting, and construction Discussion and Analysis N/A IF-EN-160a.2 Discussion included in SOC.12 Health, Safety, Environment and Wellbeing – Management Workforce Health & Safety (1) Total recordable incident rate (TRIR) and (2) fatality rate for (a) direct employees and (b) contract employees Quantitative Rate IF-EN-320.a.1 Rates are disclosed in SOC.14 Health and Safety – Metrics Discussion of process to incorporate operational- phase energy and water efficiency considerations into project planning and design Discussion and Analysis N/A IF-EN-410.a.2 Discussion included in ENV.18 Environmental Impact in Project Design and Delivery
FY 2021 ESG Disclosures 1999 Bryan Street, Suite 1200 Dallas, Texas 75201 USA +1.214.638.0145 | jacobs.com Boldly moving forward