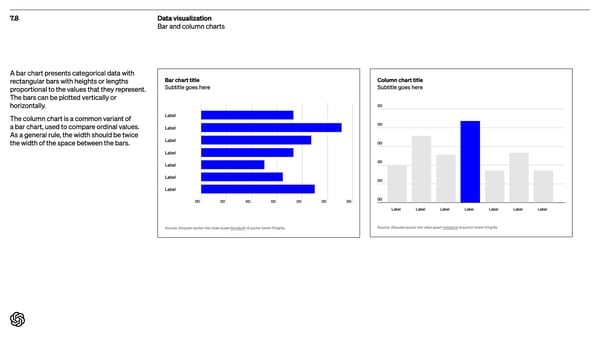
7.8 Data visualization Bar and column charts A bar chart presents categorical data with rectangular bars with heights or lengths proportional to the values that they represent . The bars can be plotted vertically or horizontally. The column chart is a common variant of a bar chart , used to compare ordinal values. As a general rule, the width should be twice the width of the space between the bars. Bar char t title Subtitle goes here 00 00 00 00 00 00 00 L abel L abel L abel L abel L abel L abel L abel S ource: Aliquam auctor nisi vitae quam tincidunt id auctor lorem fringilla . Column char t title Subtitle goes here 00 00 00 00 00 00 L abel L abel L abel L abel L abel L abel L abel S ource: Aliquam auctor nisi vitae quam tincidunt id auctor lorem fringilla .
 Open AI Brand Book Page 101 Page 103