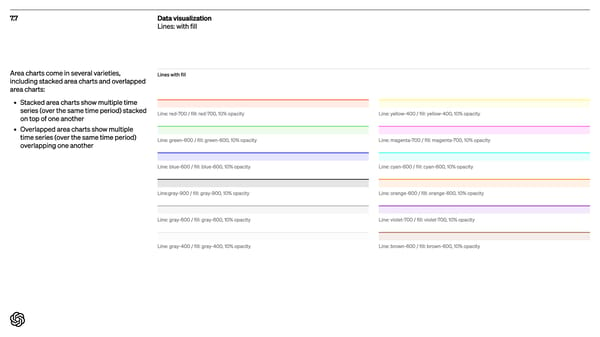
7.7 Data visualization Lines: with fill Area charts come in several varieties, including stacked area charts and overlapped area charts Stacked area charts show multiple time series (over the same time period) stacked on top of one anothe- Overlapped area charts show multiple time series (over the same time period) overlapping one another Line: red-700 / fill: red-700, 10% opacity Line: green- 600 / fill: green- 600, 10% opacity Line: blue - 600 / fill: blue - 600, 10% opacity Line:gray-900 / fill: gray-900, 10% opacity Line: gray- 600 / fill: gray- 600, 10% opacity Line: gray- 400 / fill: gray- 400, 10% opacity Line: yellow- 400 / fill: yellow- 400, 10% opacity Line: magenta-700 / fill: magenta-700, 10% opacity Line: cyan- 600 / fill: cyan- 600, 10% opacity Line: orange - 600 / fill: orange - 600, 10% opacity Line: violet-700 / fill: violet-700, 10% opacity Line: brown- 600 / fill: brown- 600, 10% opacity Lines with fill
 Open AI Brand Book Page 100 Page 102