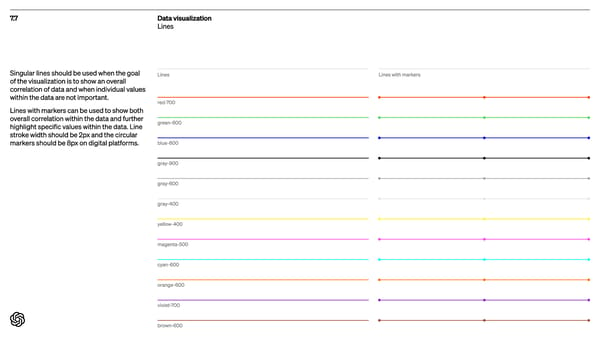
7.7 Data visualization Lines Singular lines should be used when the goal of the visualization is to show an overall correlation of data and when individual values within the data are not important . Lines with markers can be used to show both overall correlation within the data and further highlight specific values within the data . Line stroke width should be 2px and the circular markers should be 8px on digital platforms. red-700 Lines Lines with markers green- 600 blue - 600 gray-900 gray- 600 gray- 400 yellow- 400 magenta-500 cyan- 600 orange - 600 violet-700 brown- 600
 Open AI Brand Book Page 99 Page 101