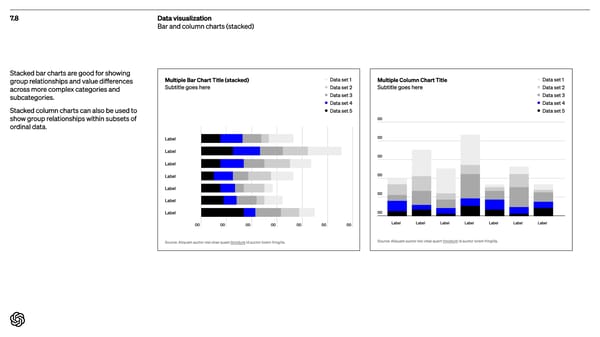
7.8 Data visualization Bar and column charts (stacked) Stacked bar charts are good for showing group relationships and value differences across more complex categories and subcategories. Stacked column charts can also be used to show group relationships within subsets of ordinal data . 00 00 00 00 00 00 00 L abel L abel L abel L abel L abel L abel L abel S ource: Aliquam auctor nisi vitae quam tincidunt id auctor lorem fringilla . Multiple Bar Char t Title (stacked) Subtitle goes here Data set 1 Data set 2 Data set 3 Data set 4 Data set 5 00 00 00 00 00 00 L abel L abel L abel L abel L abel L abel L abel S ource: Aliquam auctor nisi vitae quam tincidunt id auctor lorem fringilla . Multiple Column Char t Title Subtitle goes here Data set 1 Data set 2 Data set 3 Data set 4 Data set 5
 Open AI Brand Book Page 103 Page 105