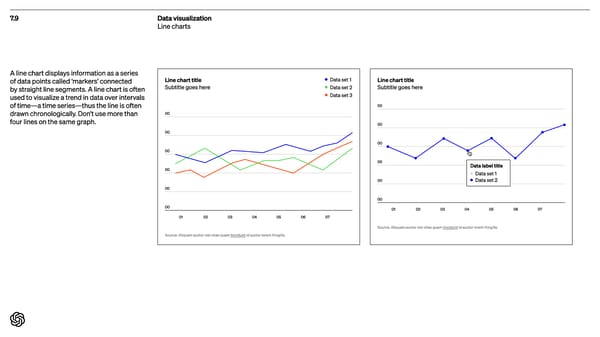
7.9 Data visualization Line charts A line chart displays information as a series of data points called ‘markers’ connected by straight line segments. A line chart is of ten used to visualize a trend in data over intervals of time —a time series—thus the line is of ten drawn chronologically. Don’t use more than four lines on the same graph. Line char t title Subtitle goes here Data set 1 Data set 2 Data set 3 00 00 00 00 00 00 01 02 03 04 05 06 07 S ource: Aliquam auctor nisi vitae quam tincidunt id auctor lorem fringilla . Line char t title Subtitle goes here 00 00 00 00 00 00 01 02 03 04 05 06 07 S ource: Aliquam auctor nisi vitae quam tincidunt id auctor lorem fringilla . Data label title Data set 1 Data set 2
 Open AI Brand Book Page 104 Page 106