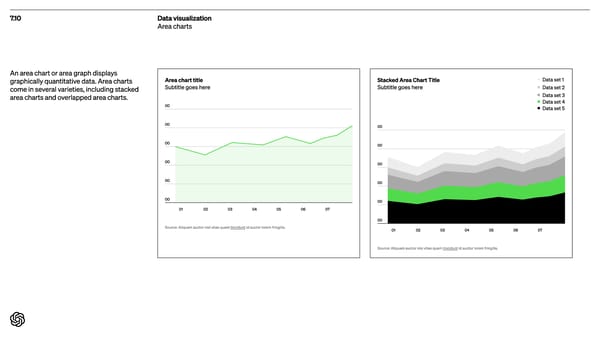
7.10 Data visualization Area charts An area chart or area graph displays graphically quantitative data . Area charts come in several varieties, including stacked area charts and overlapped area charts. Are a char t title Subtitle goes here 00 00 00 00 00 00 01 02 03 04 05 06 07 S ource: Aliquam auctor nisi vitae quam tincidunt id auctor lorem fringilla . S tacked Are a Char t Title Subtitle goes here Data set 1 Data set 2 Data set 3 Data set 4 Data set 5 00 00 00 00 00 00 01 02 03 04 05 06 07 S ource: Aliquam auctor nisi vitae quam tincidunt id auctor lorem fringilla .
 Open AI Brand Book Page 105 Page 107