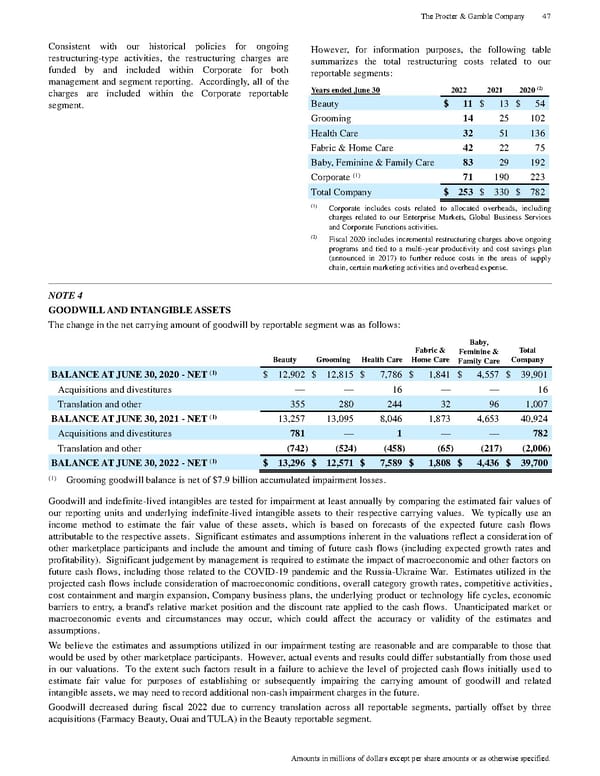
Consistent with our historical policies for ongoing restructuring - type activities, the restructuring charges are funded by and included within Corporate for both management and segment reporting. Accordingly, all of the charges are included within the Cor porate reportable segment. However, for information purposes, the following table summarizes the total restructuring costs related to our reportable segments: Years ended June 30 2022 2021 2020 (2) Beauty $ 11 $ 13 $ 54 Grooming 14 25 102 Health Care 32 51 136 Fabric & Home Care 42 22 75 Baby, Feminine & Family Care 83 29 192 Corporate (1) 71 190 223 Total Company $ 253 $ 330 $ 782 (1) Corporate includes costs related to allocated overheads, including charges related to our Enterprise Markets, Global Business Services and Corporate Functions activities. (2) Fiscal 2020 includes incremental restructuring charges above ongoing programs and tied to a multi - year productivity and cost savings plan (announced in 2017) to further reduce costs in the areas of supply chain, certain marketing activities and overhead expense. NOTE 4 GOODWILL AND INTANGIBLE ASSETS The change in the net carrying amount of goodwill by reportable segment was as follows: Beauty Grooming Health Care Fabric & Home Care Baby, Feminine & Family Care Total Company BALANCE AT JUNE 30, 2020 - NET (1) $ 12,902 $ 12,815 $ 7,786 $ 1,841 $ 4,557 $ 39,901 Acquisitions and divestitures — — 16 — — 16 Translation and other 355 280 244 32 96 1,007 BALANCE AT JUNE 30, 2021 - NET (1) 13,257 13,095 8,046 1,873 4,653 40,924 Acquisitions and divestitures 781 — 1 — — 782 Translation and other (742) (524) (458) (65) (217) (2,006) BALANCE AT JUNE 30, 2022 - NET (1) $ 13,296 $ 12,571 $ 7,589 $ 1,808 $ 4,436 $ 39,700 (1) Grooming goodwill balance is net of $7.9 billion accumulated impairment losses. Goodwill and indefinite - lived intangibles are tested for impairment at least annually by comparing the estimated fair values of our reporting units and underlying indefinite - lived intangible assets to their respective carrying values. We typically use an income method to estimate the fair value of these assets, which is based on forecasts of the expected future cash flows attributable to the respective assets. Significant estimates and assumptions inherent in the valuations reflect a considerat ion of othe r marketplace participants and include the amount and timing of future cash flows (including expected growth rates and profitability). Significant judgement by management is required to estimate the impact of macroeconomic and other factors on future cash flows, including those related to the COVID - 19 pandemic and the Russia - Ukraine War. Estimates utilized in the projected cash flows include consideration of macroeconomic conditions, overall category growth rates, competitive activities , cost containment and margin expansion, Company business plans, the underlying product or technology life cycles, economic barriers to entry, a brand's relative market position and the discount rate applied to the cash flows. Unanticipated market or macroeconomic events an d circumstances may occur, which could affect the accuracy or validity of the estimates and assumptions. We believe the estimates and assumptions utilized in our impairment testing are reasonable and are comparable to those that would be used by other ma rketplace participants. However, actual events and results could differ substantially from those used in our valuations. To the extent such factors result in a failure to achieve the level of projected cash flows initially use d to estimate fair value for purposes of establishing or subsequently impairing the carrying amount of goodwill and related intangible assets, we may need to record additional non - cash impairment charges in the future. Goodwill decreased during fiscal 2022 due to currency translatio n across all reportable segments, partially offset by three acquisitions (Farmacy Beauty, Ouai and TULA) in the Beauty reportable segment. The Procter & Gamble Company 47 Amounts in millions of dollars except per share amounts or as otherwise specified.
 The Procter & Gamble Annual Report Page 58 Page 60