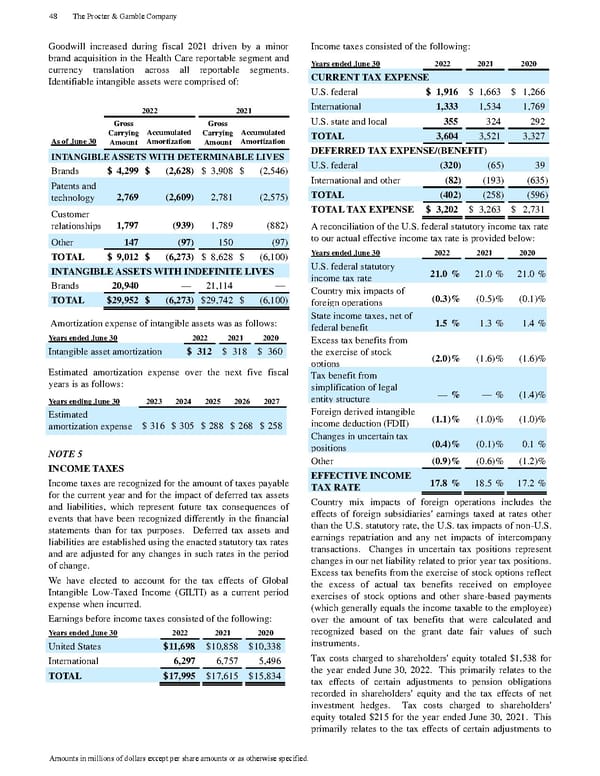
Goodwill increased during fiscal 2021 driven by a minor brand acquisition in the Health Care repor table segment and currency translation across all reportable segments. Identifiable intangible assets were comprised of: 2022 2021 As of June 30 Gross Carrying Amount Accumulated Amortization Gross Carrying Amount Accumulated Amortization INTANGIBLE ASSETS WITH DETERMINABLE LIVES Brands $ 4,299 $ (2,628) $ 3,908 $ (2,546) Patents and technology 2,769 (2,609) 2,781 (2,575) Customer relationships 1,797 (939) 1,789 (882) Other 147 (97) 150 (97) TOTAL $ 9,012 $ (6,273) $ 8,628 $ (6,100) INTANGIBLE ASSETS WITH INDEFINITE LIVES Brands 20,940 — 21,114 — TOTAL $ 29,952 $ (6,273) $ 29,742 $ (6,100) Amortization expense of intangible assets was as follows: Years ended June 30 2022 2021 2020 Intangible asset amortization $ 312 $ 318 $ 360 Estimated amortization expense over the next five fiscal years is as follows: Years ending June 30 2023 2024 2025 2026 2027 Estimated amortization expense $ 316 $ 305 $ 288 $ 268 $ 258 NOTE 5 INCOME TAXES Income taxes are recognized for the amount of taxes payable for the current year and for the impact of deferred tax assets and liabilities, which represent future tax consequences of events that have been recognized differently in the financial statements than for tax purposes. Deferred tax assets and liabilities are established using the enacted statutory tax rates and are adjusted for any changes in such rates in the period of change. We have elected to account for the tax effects of Global Intangible L ow - Taxed Income (GILTI) as a current period expense when incurred. Earnings before income taxes consisted of the following: Years ended June 30 2022 2021 2020 United States $ 11,698 $ 10,858 $ 10,338 International 6,297 6,757 5,496 TOTAL $ 17,995 $ 17,615 $ 15,834 Income taxes consisted of the following: Years ended June 30 2022 2021 2020 CURRENT TAX EXPENSE U.S. federal $ 1,916 $ 1,663 $ 1,266 International 1,333 1,534 1,769 U.S. state and local 355 324 292 TOTAL 3,604 3,521 3,327 DEFERRED TAX EXPENSE/(BENEFIT) U.S. federal (320) (65) 39 International and other (82) (193) (635) TOTAL (402) (258) (596) TOTA L TAX EXPENSE $ 3,202 $ 3,263 $ 2,731 A reconciliation of the U.S. federal statutory income tax rate to our actual effective income tax rate is provided below: Years ended June 30 2022 2021 2020 U.S. federal statutory income tax rate 21.0 % 21.0 % 21.0 % Country mix impacts of foreign operations (0.3) % (0.5) % (0.1) % State income taxes, net of federal benefit 1.5 % 1.3 % 1.4 % Excess tax benefits from the exercise of stock options (2.0) % (1.6) % (1.6) % Tax benefit from simplification of legal entity structure — % — % (1.4) % Foreign derived intangible income deduction (FDII) (1.1) % (1.0) % (1.0) % Changes in uncertain tax positions (0.4) % (0.1) % 0.1 % Other (0.9) % (0.6) % (1.2) % EFFECTIVE INCOME TAX RATE 17.8 % 18.5 % 17.2 % Country mix impacts of foreign operations includes the effects of foreign subsidiaries' earnings taxed at rates other than the U.S. statutory rate, the U.S. tax impacts of non - U .S. earnings repatriation and any net impacts of intercompany transactions. Changes in uncertain tax positions represent changes in our net liability related to prior year tax positions. Excess tax benefits from the exercise of stock options reflect the excess of actual tax benefits received on employee exercises of stock options and other share - based payments (which generally equals the income taxable to the employee) over the amount of tax benefits that were calculated and recognized based on the grant date fair values of such instruments. Tax costs charged to shareholders' equity totaled $1,538 for the year ended June 30, 2022. This primarily relates to the tax effects of certain adjustments to pension obligations recorded in shareholders' equity and t he tax effects of net investment hedges. Tax costs charged to shareholders' equity totaled $215 for the year ended June 30, 2021. This primarily relates to the tax effects of certain adjustments to 48 The Procter & Gamble Company Amounts in millions of dollars except per share amounts or as otherwise specified.
 The Procter & Gamble Annual Report Page 59 Page 61