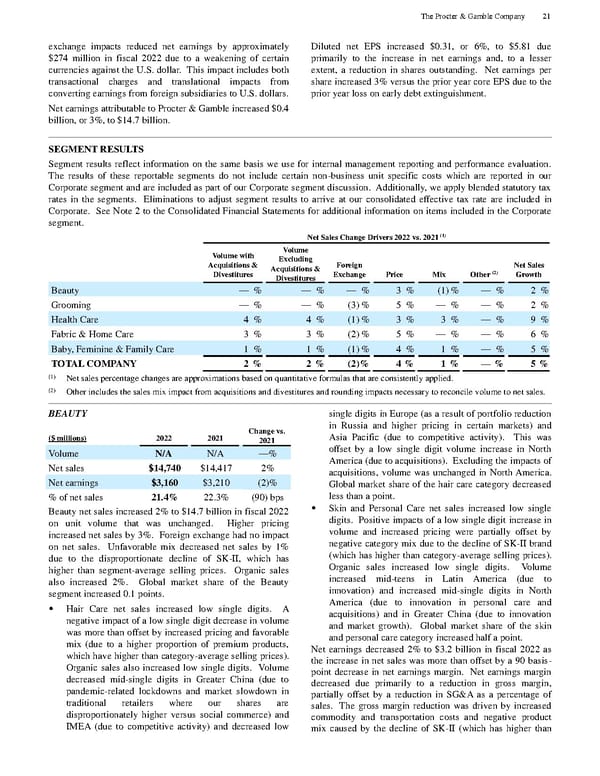
exchange impacts reduced net earnings by approximately $274 million in fiscal 2022 due to a weakening of certain currencies against the U.S. dollar. This impact includes both transactional charges and translational i mpacts from converting earnings from foreign subsidiaries to U.S. dollars. Net earnings attributable to Procter & Gamble increased $0.4 billion, or 3%, to $14.7 billion. Diluted net EPS increased $0.31, or 6%, to $5.81 due primarily to the increase in net earnings and, to a lesser extent, a reduction in shares outstanding. Net earnings per share increased 3% versus the prior year core EPS due to the prior year loss on early debt extinguishment. SEGMENT RESULTS Segment results reflect information on the same basis we use for internal management reporting and performance evaluation. The results of these reportable segments do not include certain non - business unit specific costs which are reported in our Corporate segment and are included as part of our Corporate segment discussion. Additionally, we apply blended statutory tax rates in the segments. Eliminations to adjust segment results to arrive at our consolidated effective tax rate are included in Corporate. See Not e 2 to the Consolidated Financial Statements for additional information on items included in the Corporate segment. Net Sales Change Drivers 2022 vs. 2021 (1) Volume with Acquisitions & Divestitures Volume Excluding Acquisitions & Divestitures Foreign Exchange Price Mix Other (2) Net Sales Growth Beauty — % — % — % 3 % (1) % — % 2 % Grooming — % — % (3) % 5 % — % — % 2 % Health Care 4 % 4 % (1) % 3 % 3 % — % 9 % Fabric & Home Care 3 % 3 % (2) % 5 % — % — % 6 % Baby, Feminine & Family Care 1 % 1 % (1) % 4 % 1 % — % 5 % TOTAL COMPANY 2 % 2 % (2) % 4 % 1 % — % 5 % (1) Net sales percentage changes are approximations based on quantitative formulas that are consistently applied. (2) Other includes the sales mix impact from acquisitions and divestitures and rounding impacts necessary to reconcile volume to net sales. BEAUTY ($ millions) 2022 2021 Change vs. 2021 Volume N/A N/A — % Net sales $14,740 $14,417 2% Net earnings $3,160 $3,210 (2)% % of net sales 21.4% 22.3% (90) bps Beauty net sales increased 2% to $14.7 billion in fiscal 2022 on unit volume that was unchanged. Higher pricing increased net sales by 3%. Foreign exchange had no impact on net sales. Unfavorable mix decreased net sales by 1% due to the disproportionate decline of SK - II, which has higher than segment - average selling prices. Organic sales also increased 2%. Global market share of the Beauty segment increased 0.1 points. • Hair Care net sales increased low single digits. A negative impact of a low single digit decrease in volume was more than offset by increased pricing and favorable mix (due to a higher proportion of premium products, which have higher than category - average selling prices). Organic sales also increased low single digits. Volume decreas ed mid - single digits in Greater China (due to pandemic - related lockdowns and market slowdown in traditional retailers where our shares are disproportionately higher versus social commerce) and IMEA (due to competitive activity) and decreased low single dig its in Europe (as a result of portfolio reduction in Russia and higher pricing in certain markets) and Asia Pacific (due to competitive activity). This was offset by a low single digit volume increase in North America (due to acquisitions). Excluding the impacts of acquisitions, volume was unchanged in North America. Global market share of the hair care category decreased less than a point. • Skin and Personal Care net sales increased low single digits. Positive impacts of a low single digit increase in volume and increased pricing were partially offset by negative category mix due to the decline of SK - II brand (which has higher than category - average selling prices). Organic sales increased low single digits. Volume increased mid - teens in La tin America (due to innovation) and increased mid - single digits in North America (due to innovation in personal care and acquisitions) and in Greater China (due to innovation and market growth). Global market share of the skin and personal care category i ncreased half a point. Net earnings decreased 2% to $3.2 billion in fiscal 2022 as the increase in net sales was more than offset by a 90 basis - point decrease in net earnings margin. Net earnings margin decreased due primarily to a reduction in gross marg in, partially offset by a reduction in SG&A as a percentage of sales. The gross margin reduction was driven by increased commodity and transportation costs and negative product mix caused by the decline of SK - II (which has higher than The Procter & Gamble Company 21
 The Procter & Gamble Annual Report Page 32 Page 34