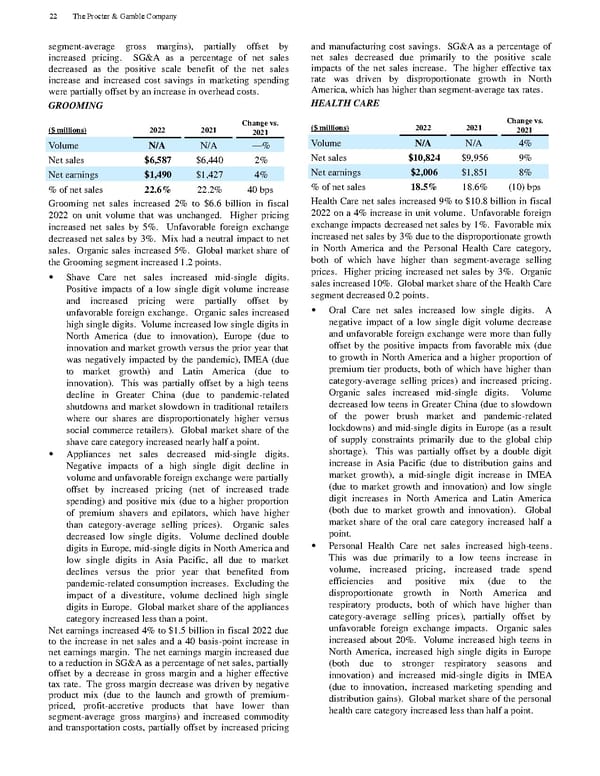
segment - average gros s margins), partially offset by increased pricing. SG&A as a percentage of net sales decreased as the positive scale benefit of the net sales increase and increased cost savings in marketing spending were partially offset by an increase in overhead costs. GROOMING ($ millions) 2022 2021 Change vs. 2021 Volume N/A N/A — % Net sales $6,587 $6,440 2% Net earnings $1,490 $1,427 4% % of net sales 22.6% 22.2% 40 bps Grooming net sales increased 2% to $6.6 billion in fiscal 2022 on unit volume that was unchanged. Higher pricing increased net sales by 5%. Unfavorable foreign exchange decreased net sales by 3%. Mix had a neutral impact to net sales. Organic sales increased 5%. Global market share of the Grooming segment increased 1.2 points. • Shave Care net sales increased mid - single digits. Positive impa cts of a low single digit volume increase and increased pricing were partially offset by unfavorable foreign exchange. Organic sales increased high single digits. Volume increased low single digits in North America (due to innovation), Europe (due to inn ovation and market growth versus the prior year that was negatively impacted by the pandemic), IMEA (due to market growth) and Latin America (due to innovation). This was partially offset by a high teens decline in Greater China (due to pandemic - related s hutdowns and market slowdown in traditional retailers where our shares are disproportionately higher versus social commerce retailers). Global market share of the shave care category increased nearly half a point. • Appliances net sales decreased mid - single digits. Negative impacts of a high single digit decline in volume and unfavorable foreign exchange were partially offset by increased pricing (net of increased trade spending) and positive mix (due to a higher proportion of premium shavers and epilators, which have higher than category - average selling prices). Organic sales decreased low single digits. Volume declined double digits in Europe, mid - single digits in North America and low single digits in Asia Pacific, all due to market declines v ersus the prior year that benefited from pandemic - related consumption increases. Excluding the impact of a divestiture, volume declined high single digits in Europe. Global market share of the appliances category increased less than a point. Net earnings increased 4% to $1.5 billion in fiscal 2022 due to the increase in net sales and a 40 basis - point increase in net earnings margin. The net earnings margin increased due to a reduction in SG&A as a percentage of net sales, partially offset by a decrease i n gross margin and a higher effective tax rate. The gross margin decrease was driven by negative product mix (due to the launch and growth of premium - priced, profit - accretive products that have lower than segment - average gross margins) and increased commo dity and transportation costs, partially offset by increased pricing and manufacturing cost savings. SG&A as a percentage of net sales decreased due primarily to the positive scale impacts of the net sales increase. The higher effective tax rate was driv en by disproportionate growth in North America, which has higher than segment - average tax rates. HEALTH CARE ($ millions) 2022 2021 Change vs. 2021 Volume N/A N/A 4% Net sales $10,824 $9,956 9% Net earnings $2,006 $1,851 8% % of net sales 18.5% 18.6% (10) bps Health Care net sales increased 9% to $10.8 billion in fiscal 2022 on a 4% increase in unit volume. Unfavorable foreign exchange impacts decreased net sales by 1%. Favorable mix increased net sales by 3% due to the disproportionate growth in North America and the Personal Health Care category, both of which have higher than segment - average selling prices. Higher pricing increased net sale s by 3%. Organic sales increased 10%. Global market share of the Health Care segment decreased 0.2 points. • Oral Care net sales increased low single digits. A negative impact of a low single digit volume decrease and unfavorable foreign exchange were mor e than fully offset by the positive impacts from favorable mix (due to growth in North America and a higher proportion of premium tier products, both of which have higher than category - average selling prices) and increased pricing. Organic sales increased mid - single digits. Volume decreased low teens in Greater China (due to slowdown of the power brush market and pandemic - related lockdowns) and mid - single digits in Europe (as a result of supply constraints primarily due to the global chip shortage). This was partially offset by a double digit increase in Asia Pacific (due to distribution gains and market growth), a mid - single digit increase in IMEA (due to market growth and innovation) and low single digit increases in North America and Latin America (bot h due to market growth and innovation). Global market share of the oral care category increased half a point. • Personal Health Care net sales increased high - teens. This was due primarily to a low teens increase in volume, increased pricing, increased trade spend efficiencies and positive mix (due to the disproportionate growth in North America and respiratory products, both of which have higher than category - average selling prices), partially offset by unfavorable foreign exchange impacts. O rganic sales increased about 20%. Volume increased high teens in North America, increased high single digits in Europe (both due to stronger respiratory seasons and innovation) and increased mid - single digits in IMEA (due to innovation, increased marketin g spending and distribution gains). Global market share of the personal health care category increased less than half a point. 22 The Procter & Gamble Company
 The Procter & Gamble Annual Report Page 33 Page 35