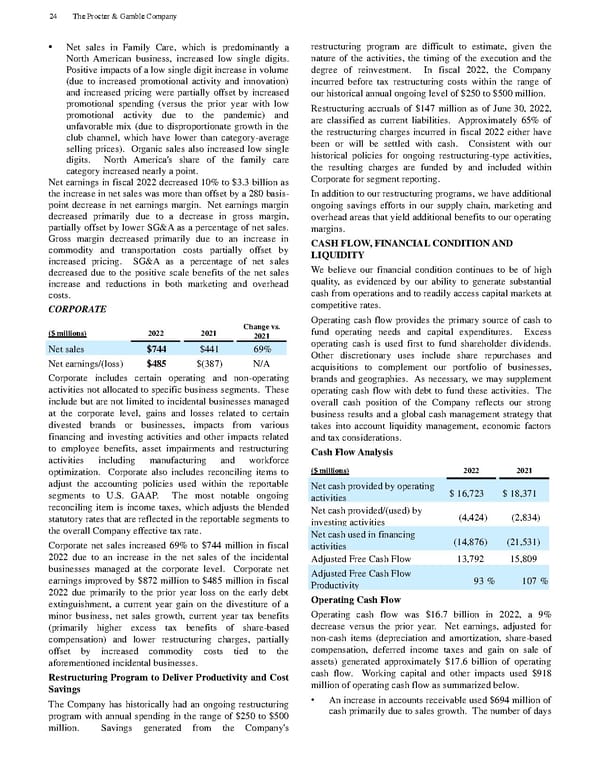
• Net sales in Family Care, which is predominantly a North Amer ican business, increased low single digits. Positive impacts of a low single digit increase in volume (due to increased promotional activity and innovation) and increased pricing were partially offset by increased promotional spending (versus the prior ye ar with low promotional activity due to the pandemic) and unfavorable mix (due to disproportionate growth in the club channel, which have lower than category - average selling prices). Organic sales also increased low single digits. North America's share o f the family care category increased nearly a point. Net earnings in fiscal 2022 decreased 10% to $3.3 billion as the increase in net sales was more than offset by a 280 basis - point decrease in net earnings margin. Net earnings margin decreased primarily due to a decrease in gross margin, partially offset by lower SG&A as a percentage of net sales. Gross margin decreased primarily due to an increase in commodity and transportation costs partially offset by increased pricing. SG&A as a percentage of net s ales decreased due to the positive scale benefits of the net sales increase and reductions in both marketing and overhead costs. CORPORATE ($ millions) 2022 2021 Change vs. 2021 Net sales $744 $441 69% Net earnings/(loss) $485 $(387) N/A Corporate includes certain operating and non - operating activities not allocated to specific business segments. These include but are not limited to incidental businesses managed at the corporate level, gains and losses related to certain divested brands or businesses, impacts from various financing and investing activities and other impacts related to employee benefits, asset impairments and restructuring activities including manufacturi ng and workforce optimization. Corporate also includes reconciling items to adjust the accounting policies used within the reportable segments to U.S. GAAP. The most notable ongoing reconciling item is income taxes, which adjusts the blended statutory ra tes that are reflected in the reportable segments to the overall Company effective tax rate. Corporate net sales increased 69% to $744 million in fiscal 2022 due to an increase in the net sales of the incidental businesses managed at the corporate level. Corporate net earnings improved by $872 million to $485 million in fiscal 2022 due primarily to the prior year loss on the early debt extinguishment, a current year gain on the divestiture of a minor business, net sales growth, current year tax benefits (primarily higher excess tax benefits of share - based compensation) and lower restructuring char ges, partially offset by increased commodity costs tied to the aforementioned incidental businesses. Restructuring Program to Deliver Productivity and Cost Savings The Company has historically had an ongoing restructuring program with annual spending in the range of $250 to $500 million. Savings generated from the Company's restructuring program are difficult to estimate, given the nature of the activities, the timi ng of the execution and the degree of reinvestment. In fiscal 2022, the Company incurred before tax restructuring costs within the range of our historical annual ongoing level of $250 to $500 million. Restructuring accruals of $147 million as of June 30, 2022, are classified as current liabilities. Approximately 65% of the restructuring charges incurred in fiscal 2022 either have been or will be settled with cash. Consistent with our historical policies for ongoing restructuring - type activities, the resu lting charges are funded by and included within Corporate for segment reporting. In addition to our restructuring programs, we have additional ongoing savings efforts in our supply chain, marketing and overhead areas that yield additional benefits to our o perating margins. CASH FLOW, FINANCIAL CONDITION AND LIQUIDITY We believe our financial condition continues to be of high quality, as evidenced by our ability to generate substantial cash from operations and to readily access capital markets at competitive rates. Operating cash flow provides the primary source of cash to fund operating needs and capital expenditures. Excess operating cash is used first to fund shareholder dividends. Other discretionary uses include share repurchases and acquisitions to co mplement our portfolio of businesses, brands and geographies. As necessary, we may supplement operating cash flow with debt to fund these activities. The overall cash position of the Company reflects our strong business results and a global cash manageme nt strategy that takes into account liquidity management, economic factors and tax considerations. Cash Flow Analysis ($ millions) 2022 2021 Net cash provided by operating activities $ 16,723 $ 18,371 Net cash provided/(used) by investing activities (4,424) (2,834) Net cash used in financing activities (14,876) (21,531) Adjusted Free Cash Flow 13,792 15,809 Adjusted Free Cash Flow Productivity 93 % 107 % Operating Cash Flow Operating cash flow was $16.7 billion in 2022, a 9% decrease versus the prior year. Net earnings, adjusted for non - cash items (depreciation and amortization, share - based compensation, deferred income taxes and gain on sale of assets) generated approximately $17.6 billion of operating cash flow. Working capital and other impacts used $918 million of operating cash flow as summarized below. • An increase in accounts receivable used $694 million of cash primarily due to sales growth. The number of days 24 The Procter & Gamble Company
 The Procter & Gamble Annual Report Page 35 Page 37