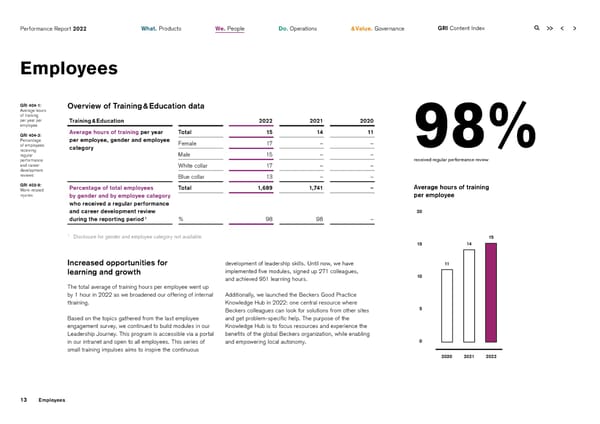
Performance Report 2022 What. Products We. People Do. Operations & Value. Governance GRI Content Index Employees GRI 404-1: Overview of Training & Education data Average hours of training per year per Training & Education 2022 2021 2020 employee GRI 404-3: Average hours of training per year Total 15 14 11 Percentage per employee, gender and employee Female 17 – – of employees category 98% receiving Male 15 – – regular performance received regular performance review and career White collar 17 – – development reviews Blue collar 13 – – GRI 403-9: Percentage of total employees Total 1,689 1,741 – Average hours of training Work-related injuries by gender and by employee category per employee who received a regular performance and career development review 20 1 during the reporting period % 98 98 – 1 Disclosure for gender and employee category not available. 15 15 14 Increased opportunities for development of leadership skills. Until now, we have 11 learning and growth implemented five modules, signed up 271 colleagues, and achieved 951 learning hours. 10 The total average of training hours per employee went up by 1 hour in 2022 as we broadened our offering of internal Additionally, we launched the Beckers Good Practice ttraining. Knowledge Hub in 2022: one central resource where Beckers colleagues can look for solutions from other sites 5 Based on the topics gathered from the last employee and get problem-specific help. The purpose of the engagement survey, we continued to build modules in our Knowledge Hub is to focus resources and experience the Leadership Journey. This program is accessible via a portal benefits of the global Beckers organization, while enabling in our intranet and open to all employees. This series of and empowering local autonomy. 0 small training impulses aims to inspire the continuous 2020 2021 2022 13 Employees
 2022 | ESG Report Page 12 Page 14