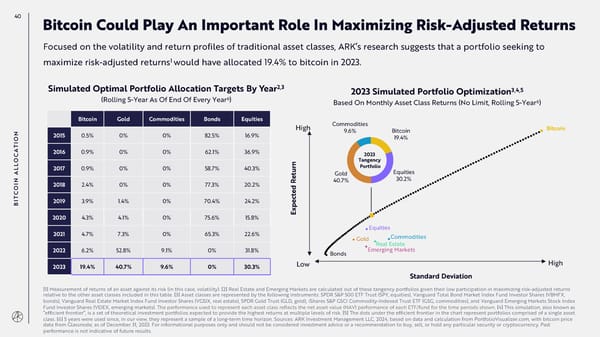
40 Bitcoin Could Play An Important Role In Maximizing Risk-Adjusted Returns Focused on the volatility and return profiles of traditional asset classes, ARK’s research suggests that a portfolio seeking to 1 maximize risk-adjusted returns would have allocated 19.4% to bitcoin in 2023. 2,3 Simulated Optimal Portfolio Allocation Targets By Year 2023 Simulated Portfolio Optimization3,4,5 6 (Rolling 5-Year As Of End Of Every Year ) Based On Monthly Asset Class Returns (No Limit, Rolling 5-Year6) Bitcoin Gold Commodities Bonds Equities Commodities High 9.6% Bitcoin Bitcoin ON 2015 0.5% 0% 0% 82.5% 16.9% 19.4% I T A 2016 0.9% 0% 0% 62.1% 36.9% 2023 OC n Tangency L r Portfolio L 2017 0.9% 0% 0% 58.7% 40.3% u Equities A t Gold e 30.2% N R 40.7% 2018 2.4% 0% 0% 77.3% 20.2% OI d C e T ct BI 2019 3.9% 1.4% 0% 70.4% 24.2% e p x E 2020 4.3% 4.1% 0% 75.6% 15.8% Equities 2021 4.7% 7.3% 0% 65.3% 22.6% Gold Commodities Real Estate 2022 6.2% 52.8% 9.1% 0% 31.8% Bonds Emerging Markets 2023 19.4% 40.7% 9.6% 0% 30.3% Low High Standard Deviation [1] Measurement of returns of an asset against its risk (in this case, volatility). [2] Real Estate and Emerging Markets are calculated out of these tangency portfolios given their low participation in maximizing risk-adjusted returns relative to the other asset classes included in this table. [3] Asset classes are represented by the following instruments: SPDR S&P 500 ETF Trust (SPY, equities), Vanguard Total Bond Market Index Fund Investor Shares (VBMFX, bonds), Vanguard Real Estate Market Index Fund Investor Shares (VGSIX, real estate), SPDR Gold Trust (GLD, gold), iShares S&P GSCI Commodity-Indexed Trust ETF (GSG, commodities), and Vanguard Emerging Markets Stock Index Fund Investor Shares (VEIEX, emerging markets). The performance used to represent each asset class reflects the net asset value (NAV) performance of each ETF/fund for the time periods shown. [4] This simulation, also known as “efficient frontier”, is a set of theoretical investment portfolios expected to provide the highest returns at multiple levels of risk. [5] The dots under the efficient frontier in the chart represent portfolios comprised of a single asset class. [6] 5 years were used since, in our view, they represent a sample of a long-term time horizon. Sources: ARK Investment Management LLC, 2024, based on data and calculation from PortfolioVisualizer.com, with bitcoin price data from Glassnode, as of December 31, 2023. For informational purposes only and should not be considered investment advice or a recommendation to buy, sell, or hold any particular security or cryptocurrency. Past performance is not indicative of future results.
 Annual Research Report | Big Ideas 2024 Page 39 Page 41