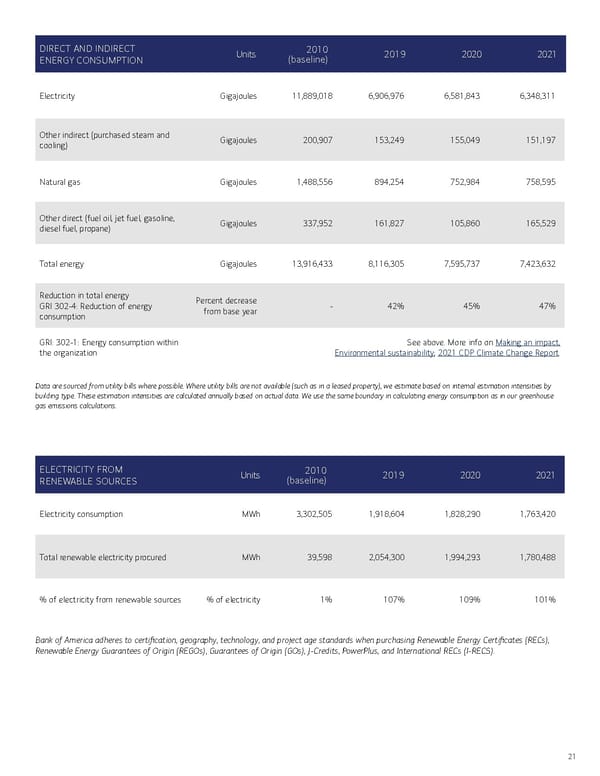
DIRECT AND INDIRECT ENERGY CONSUMPTION Units 2010 (baseline) 2019 2020 2021 Electricity Gigajoules 11,889,018 6,906,976 6,581,843 6,348,311 Other indirect (purchased steam and cooling) Gigajoules 200,907 153,249 155,049 151,197 Natural gas Gigajoules 1,488,556 894,254 752,984 758,595 Other direct (fuel oil, jet fuel, gasoline, diesel fuel, propane) Gigajoules 337,952 161,827 105,860 165,529 Total energy Gigajoules 13,916,433 8,116,305 7,595,737 7,423,632 Reduction in total energy GRI 302-4: Reduction of energy consumption Percent decrease from base year - 42% 45% 47% GRI : 302-1: Energy consumption within the organization See above. More info on Making an impact, Environmental sustainability ; 2021 CDP Climate Change Report . Data are sourced from utility bills where possible. Where utility bills are not available (such as in a leased property), we estimate based on internal estimation intensities by building type. These estimation intensities are calculated annually based on actual data. We use the same boundary in calculating energy consumption as in our greenhouse gas emissions calculations. ELECTRICITY FROM RENEWABLE SOURCES Units 2010 (baseline) 2019 2020 2021 Electricity consumption MWh 3,302,505 1,918,604 1,828,290 1,763,420 Total renewable electricity procured MWh 39,598 2,054,300 1,994,293 1,780,488 % of electricity from renewable sources % of electricity 1% 107% 109% 101% Bank of America adheres to certification, geography, technology, and project age standards when purchasing Renewable Energy Certificates (RECs), Renewable Energy Guarantees of Origin (REGOs), Guarantees of Origin (GOs), J-Credits, PowerPlus, and International RECs (I-RECS). 21
 Bank of America ESG Report Page 20 Page 22