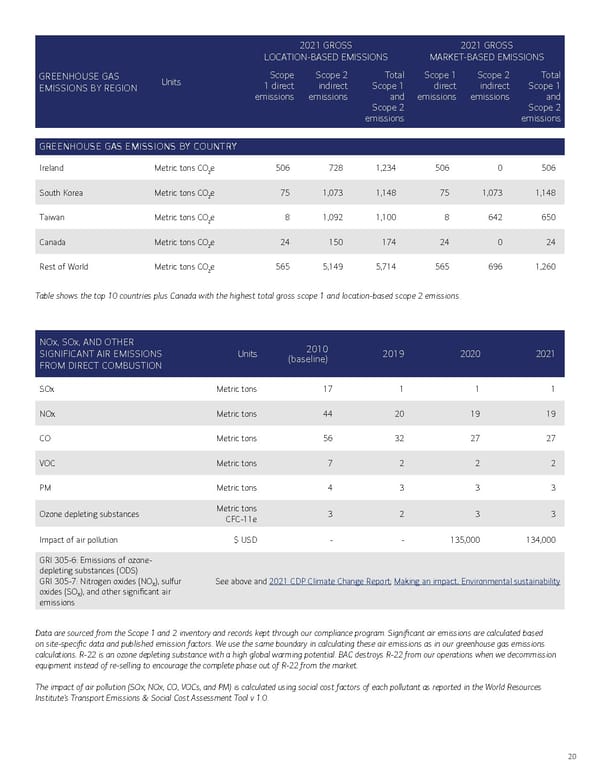
20 GREENHOUSE GAS EMISSIONS BY REGION Units Scope 1 direct emissions Scope 2 indirect emissions Total Scope 1 and Scope 2 emissions Scope 1 direct emissions Scope 2 indirect emissions Total Scope 1 and Scope 2 emissions 2021 GROSS LOCATION-BASED EMISSIONS 2021 GROSS MARKET-BASED EMISSIONS GREENHOUSE GAS EMISSIONS BY COUNTRY Ireland Metric tons CO 2 e 506 728 1,234 506 0 506 South Korea Metric tons CO 2 e 75 1,073 1,148 75 1,073 1,148 Taiwan Metric tons CO 2 e 8 1,092 1,100 8 642 650 Canada Metric tons CO 2 e 24 150 174 24 0 24 Rest of World Metric tons CO 2 e 565 5,149 5,714 565 696 1,260 Table shows the top 10 countries plus Canada with the highest total gross scope 1 and location-based scope 2 emissions. NOx, SOx, AND OTHER SIGNIFICANT AIR EMISSIONS FROM DIRECT COMBUSTION Units 2010 (baseline) 2019 2020 2021 SOx Metric tons 17 1 1 1 NOx Metric tons 44 20 19 19 CO Metric tons 56 32 27 27 VOC Metric tons 7 2 2 2 PM Metric tons 4 3 3 3 Ozone depleting substances Metric tons CFC-11e 3 2 3 3 Impact of air pollution $ USD - - 135,000 134,000 GRI 305-6: Emissions of ozone- depleting substances (ODS) GRI 305-7: Nitrogen oxides (NO X ), sulfur oxides (SO X ), and other significant air emissions See above and 2021 CDP Climate Change Report ; Making an impact, Environmental sustainability Data are sourced from the Scope 1 and 2 inventory and records kept through our compliance program. Significant air emissions are calculated based on site-specific data and published emission factors. We use the same boundary in calculating these air emissions as in our greenhouse gas emissions calculations. R-22 is an ozone depleting substance with a high global warming potential. BAC destroys R-22 from our operations when we decommission equipment instead of re-selling to encourage the complete phase out of R-22 from the market. The impact of air pollution (SOx, NOx, CO, VOCs, and PM) is calculated using social cost factors of each pollutant as reported in the World Resources Institute ’s Transport Emissions & Social Cost Assessment Tool v 1.0.
 Bank of America ESG Report Page 19 Page 21