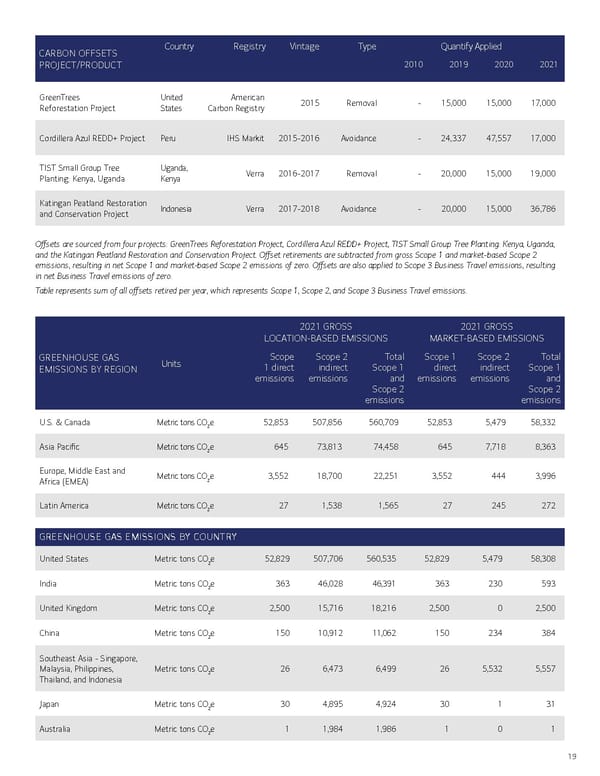
CARBON OFFSETS PROJECT/PRODUCT Country Registry Vintage Type Quantify Applied 2010 2019 2020 2021 GreenTrees Reforestation Project United States American Carbon Registry 2015 Removal - 15,000 15,000 17, 000 Cordillera Azul REDD+ Project Peru IHS Markit 2015-2016 Avoidance - 24,337 47,557 17,000 TIST Small Group Tree Planting: Kenya, Uganda Uganda, Kenya Verra 2016-2017 Removal - 20,000 15,000 19,000 Katingan Peatland Restoration and Conservation Project Indonesia Verra 2017-2018 Avoidance - 20,000 15,000 36,786 Offsets are sourced from four projects: GreenTrees Reforestation Project, Cordillera Azul REDD+ Project, TIST Small Group Tree Planting: Kenya, Uganda, and the Katingan Peatland Restoration and Conservation Project. Offset retirements are subtracted from gross Scope 1 and market-based Scope 2 emissions, resulting in net Scope 1 and market-based Scope 2 emissions of zero. Offsets are also applied to Scope 3 Business Travel emissions, resulting in net Business Travel emissions of zero. Table represents sum of all offsets retired per year, which represents Scope 1, Scope 2, and Scope 3 Business Travel emissions. GREENHOUSE GAS EMISSIONS Units 2021 GROSS LOCATION-BASED EMISSIONS 2021 GROSS MARKET-BASED EMISSIONS Scope 1 direct emissions Scope 2 indirect emissions Total Scope 1 and Scope 2 emissions Scope 1 direct emissions Scope 2 indirect emissions Total Scope 1 and Scope 2 emissions BY REGION U.S. & Canada Metric tons CO 2 e 52,853 507,856 560,709 52,853 5,479 58,332 Asia Pacific Metric tons CO 2 e 645 73,813 74,458 645 7,718 8,363 Europe, Middle East and Africa (EMEA) Metric tons CO 2 e 3,552 18,700 22,251 3,552 444 3,996 Latin America Metric tons CO 2 e 27 1,538 1,565 27 245 272 19 GREENHOUSE GAS EMISSIONS BY COUNTRY United States Metric tons CO 2 e 52,829 507,706 560,535 52,829 5,479 58,308 India Metric tons CO 2 e 363 46,028 46,391 363 230 593 United Kingdom Metric tons CO 2 e 2,500 15,716 18,216 2,500 0 2,500 China Metric tons CO 2 e 150 10,912 11,062 150 234 384 Southeast Asia - Singapore, Malaysia, Philippines, Thailand, and Indonesia Metric tons CO 2 e 26 6,473 6,499 26 5,532 5,557 Japan Metric tons CO 2 e 30 4,895 4,924 30 1 31 Australia Metric tons CO 2 e 1 1,984 1,986 1 0 1
 Bank of America ESG Report Page 18 Page 20