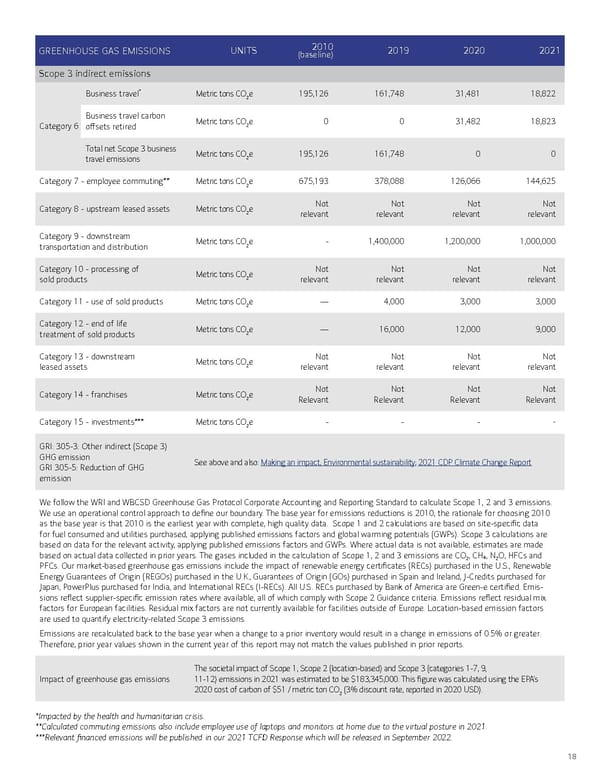
GREENHOUSE GAS EMISSIONS UNITS 2010 (baseline) 2019 2020 2021 Scope 3 indirect emissions Category 6 Business travel * Metric tons CO 2 e 195,126 161,748 31,481 18,822 Business travel carbon offsets retired Metric tons CO 2 e 0 0 31,482 18,823 Total net Scope 3 business travel emissions Metric tons CO 2 e 195,126 161,748 0 0 Category 7 - employee commuting** Metric tons CO 2 e 675,193 378,088 126,066 144,625 Category 8 - upstream leased assets Metric tons CO 2 e Not relevant Not relevant Not relevant Not relevant Category 9 - downstream transportation and distribution Metric tons CO 2 e - 1,400,000 1,200,000 1,000,000 Category 10 - processing of sold products Metric tons CO 2 e Not relevant Not relevant Not relevant Not relevant Category 11 - use of sold products Metric tons CO 2 e — 4,000 3,000 3,000 Category 12 - end of life treatment of sold products Metric tons CO 2 e — 16,000 12,000 9,000 Category 13 - downstream leased assets Metric tons CO 2 e Not relevant Not relevant Not relevant Not relevant Category 14 - franchises Metric tons CO 2 e Not Relevant Not Relevant Not Relevant Not Relevant Category 15 - investments*** Metric tons CO 2 e - - - - GRI: 305-3: Other indirect (Scope 3) GHG emission GRI 305-5: Reduction of GHG emission See above and also: Making an impact, Environmental sustainability ; 2021 CDP Climate Change Report We follow the WRI and WBCSD Greenhouse Gas Protocol Corporate Accounting and Reporting Standard to calculate Scope 1, 2 and 3 emissions. We use an operational control approach to define our boundary. The base year for emissions reductions is 2010; the rationale for choosing 2010 as the base year is that 2010 is the earliest year with complete, high quality data. Scope 1 and 2 calculations are based on site-specific data for fuel consumed and utilities purchased, applying published emissions factors and global warming potentials (GWPs). Scope 3 calculations are based on data for the relevant activity, applying published emissions factors and GWPs. Where actual data is not available, estimates are made based on actual data collected in prior years. The gases included in the calculation of Scope 1, 2 and 3 emissions are CO 2 , CH 4 , N 2 O, HFCs and PFCs. Our market-based greenhouse gas emissions include the impact o f renewable energy certificates (RECs) purchased in the U.S., Renewable Energy Guarantees of Origin (REGOs) purchased in the U.K., Guarantees of Origin (GOs) purchased in Spain and Ireland, J-Credits purchased f or Japan, PowerPlus purchased for India, and International RECs (I-RECs). All U.S. RECs purchased by Bank of America are Green-e certified. Emis sions reflect supplier-specific emission rates where available, all of which comply with Scope 2 Guidance criteria. Emissions reflect residual mix factors for European facilities. Residual mix factors are not currently available for facilities outside of Europe. Location-based emission factors are used to quantify electricity-related Scope 3 emissions. - Emissions are recalculated back to the base year when a change to a prior inventory would result in a change in emissions of 0.5% or greater. Therefore, prior year values shown in the current year of this report may not match the values published in prior reports. Impact of greenhouse gas emissions The societal impact of Scope 1, Scope 2 (location-based) and Scope 3 (categories 1-7, 9, 11-12) emissions in 2021 was estimated to be $183,345,000. This figure was calculated using the EP A’s 2020 cost of carbon of $51 / metric ton CO 2 (3% discount rate, reported in 2020 USD). *Impacted by the health and humanitarian crisis. **Calculated commuting emissions also include employee use of laptops and monitors at home due to the virtual posture in 2021. ***Relevant financed emissions will be published in our 2021 TCFD Response which will be released in September 2022. 18
 Bank of America ESG Report Page 17 Page 19