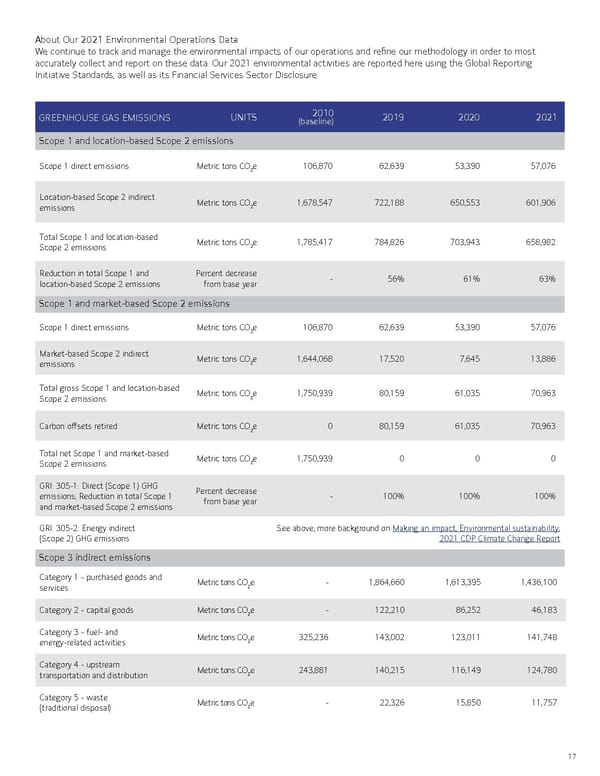
About Our 2021 Environmental Operations Data We continue to track and manage the environmental impacts of our operations and refine our methodology in order to most accurately collect and report on these data. Our 2021 environmental activities are reported here using the Global Reporting Initiative Standards, as well as its Financial Services Sector Disclosure. GREENHOUSE GAS EMISSIONS UNITS 2010 (baseline) 2019 2020 2021 Scope 1 and location-based Scope 2 emissions Scope 1 direct emissions Metric tons CO 2 e 106,870 62,639 53,390 57,076 Location-based Scope 2 indirect emissions Metric tons CO 2 e 1,678,547 722,188 650,553 601,906 Total Scope 1 and location-based Scope 2 emissions Metric tons CO 2 e 1,785,417 784,826 703,943 658,982 Reduction in total Scope 1 and location-based Scope 2 emissions Percent decrease from base year - 56% 61% 63% Scope 1 and market-based Scope 2 emissions Scope 1 direct emissions Metric tons CO 2 e 106,870 62,639 53,390 57,076 Market-based Scope 2 indirect emissions Metric tons CO 2 e 1,644,068 17,520 7,645 13,886 Total gross Scope 1 and location-based Scope 2 emissions Metric tons CO 2 e 1,750,939 80,159 61,035 70,963 Carbon offsets retired Metric tons CO 2 e 0 80,159 61,035 70,963 Total net Scope 1 and market-based Scope 2 emissions Metric tons CO 2 e 1,750,939 0 0 0 GRI : 305-1: Direct (Scope 1) GHG emissions; Reduction in total Scope 1 and market-based Scope 2 emissions Percent decrease from base year - 100% 100% 100% GRI : 305-2: Energy indirect (Scope 2) GHG emissions See above; more background on Making an impact, Environmental sustainability ; 2021 CDP Climate Change Report Scope 3 indirect emissions 17 Category 1 - purchased goods and services Metric tons CO 2 e - 1,864,660 1,613,395 1,436,100 Category 2 - capital goods Metric tons CO 2 e - 122,210 86,252 46,183 Category 3 - fuel- and energy-related activities Metric tons CO 2 e 325,236 143,002 123,011 141,748 Category 4 - upstream transportation and distribution Metric tons CO 2 e 243,881 140,215 116,149 124,780 Category 5 - waste (traditional disposal) Metric tons CO 2 e - 22,326 15,850 11,757
 Bank of America ESG Report Page 16 Page 18