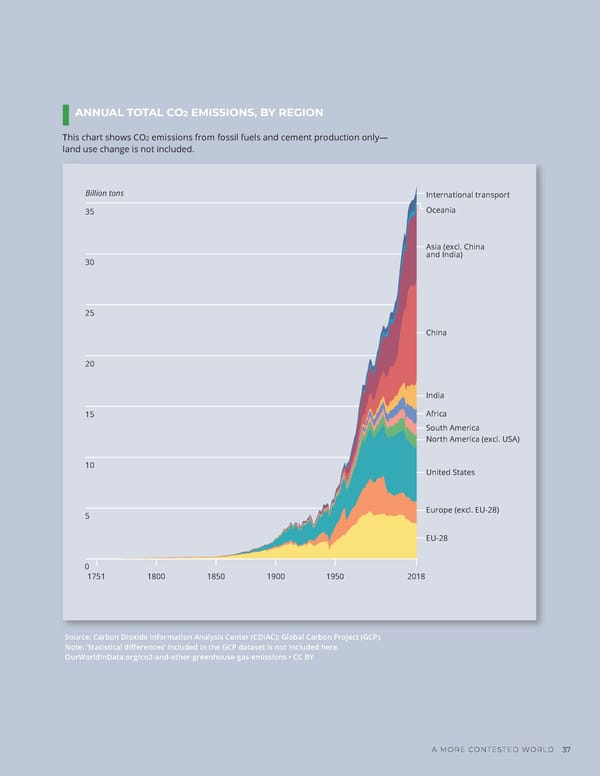
ANNUAL TOTAL CO2 EMISSIONS, BY REGION This chart shows CO2 emissions from fossil fuels and cement production only— land use change is not included. Billion tons International transport 35 Oceania Asia (excl. China 30 and India) 25 China 20 India 15 Africa South America North America (excl. USA) 10 United States 5 Europe (excl. EU-28) EU-28 0 1751 1800 1850 1900 1950 2018 Source: Carbon Dioxide Information Analysis Center (CDIAC); Global Carbon Project (GCP). Note: ‘Statistical differences’ included in the GCP dataset is not included here. OurWorldInData.org/co2-and-other-greenhouse-gas-emissions • CC BY A MORE CONTESTED WORLD 37
 GlobalTrends 2040 Page 44 Page 46