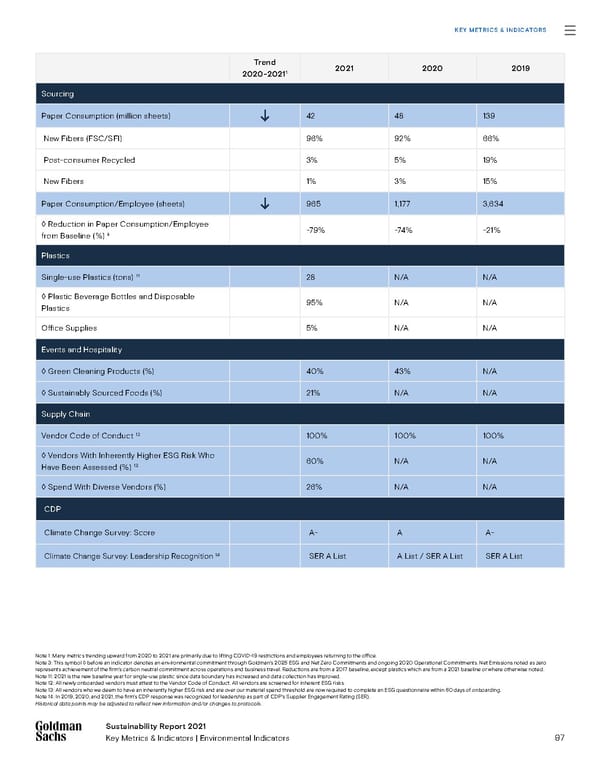
97 Sustainability Report 2021 Key Metrics & Indicators | Environmental Indicators Sustainability Report 2021 Key Metrics & Indicators KEY METRICS & INDICATORS Note 1: Many metrics trending upward from 2020 to 2021 are primarily due to lifting COVID-19 restrictions and employees returning to the office. Note 3: This symbol ◊ before an indicator denotes an environmental commitment through Goldman’s 2025 ESG and Net Zero Commitments and ongoing 2020 Operational Commitments. Net Emissions noted as zero represents achievement of the firm’s carbon neutral commitment across operations and business travel. Reductions are from a 2017 baseline, except plastics which are from a 2021 baseline or where otherwise noted. Note 11: 2021 is the new baseline year for single-use plastic since data boundary has increased and data collection has improved. Note 12: All newly onboarded vendors must attest to the Vendor Code of Conduct. All vendors are screened for inherent ESG risks. Note 13: All vendors who we deem to have an inherently higher ESG risk and are over our material spend threshold are now required to complete an ESG questionnaire within 60 days of onboarding. Note 14: In 2019, 2020, and 2021, the firm’s CDP response was recognized for leadership as part of CDP’s Supplier Engagement Rating (SER). Historical data points may be adjusted to reflect new information and/or changes to protocols. Trend 2020-2021 1 2021 2020 2019 Sourcing Paper Consumption (million sheets) 42 48 139 New Fibers (FSC/SFI) 96% 92% 66% Post-consumer Recycled 3% 5% 19% New Fibers 1% 3% 15% Paper Consumption/Employee (sheets) 965 1,177 3,634 ◊ Reduction in Paper Consumption/Employee from Baseline (%) 3 -79 % -74% -21% Plastics Single-use Plastics (tons) 11 28 N/A N/A ◊ Plastic Beverage Bottles and Disposable Plastics 95% N/A N/A Office Supplies 5% N/A N/A Events and Hospitality ◊ Green Cleaning Products (%) 40% 43% N/A ◊ Sustainably Sourced Foods (%) 21% N/A N/A Supply Chain Vendor Code of Conduct 12 100% 100% 100% ◊ Vendors With Inherently Higher ESG Risk Who Have Been Assessed (%) 13 60% N/A N/A ◊ Spend With Diverse Vendors (%) 26% N/A N/A CDP Climate Change Survey: Score A- A A- Climate Change Survey: Leadership Recognition 14 SER A List A List / SER A List SER A List
 Goldman Sachs Group Sustainability Report Page 96 Page 98