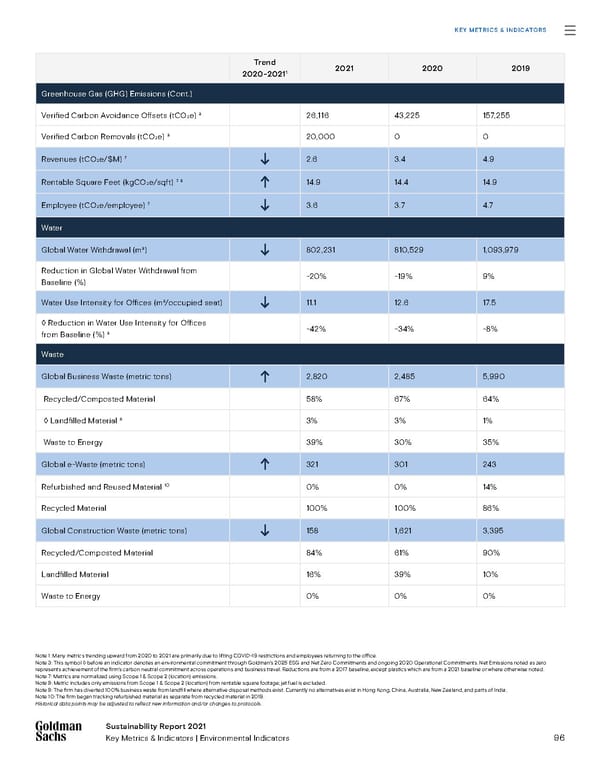
96 Sustainability Report 2021 Key Metrics & Indicators | Environmental Indicators Sustainability Report 2021 Key Metrics & Indicators KEY METRICS & INDICATORS Note 1: Many metrics trending upward from 2020 to 2021 are primarily due to lifting COVID-19 restrictions and employees returning to the office. Note 3: This symbol ◊ before an indicator denotes an environmental commitment through Goldman’s 2025 ESG and Net Zero Commitments and ongoing 2020 Operational Commitments. Net Emissions noted as zero represents achievement of the firm’s carbon neutral commitment across operations and business travel. Reductions are from a 2017 baseline, except plastics which are from a 2021 baseline or where otherwise noted. Note 7: Metrics are normalized using Scope 1 & Scope 2 (location) emissions. Note 8: Metric includes only emissions from Scope 1 & Scope 2 (location) from rentable square footage; jet fuel is excluded. Note 9: The firm has diverted 100% business waste from landfill where alternative disposal methods exist. Currently no alternatives exist in Hong Kong, China, Australia, New Zealand, and parts of India. Note 10: The firm began tracking refurbished material as separate from recycled material in 2019. Historical data points may be adjusted to reflect new information and/or changes to protocols. Trend 2020-2021 1 2021 2020 2019 Greenhouse Gas (GHG) Emissions (Cont.) Verified Carbon Avoidance Offsets (tCO 2e) 3 26,116 43,225 157, 255 Verified Carbon Removals (tCO 2e) 3 20,000 0 0 Revenues (tCO 2e/$M) 7 2.6 3.4 4.9 Rentable Square Feet (kgCO 2e/sqft) 7 , 8 14.9 14.4 14.9 Employee (tCO 2e/employee) 7 3.6 3.7 4.7 Water Global Water Withdrawal (m 3) 802,231 810,529 1,093,979 Reduction in Global Water Withdrawal from Baseline (%) -20% -19% 9% Water Use Intensity for Offices (m 3/occupied seat) 11.1 12.6 17. 5 ◊ Reduction in Water Use Intensity for Offices from Baseline (%) 3 -42% -34% -8% Waste Global Business Waste (metric tons) 2,820 2,485 5,990 Recycled/Composted Material 58% 67% 64% ◊ Landfilled Material 9 3% 3% 1% Waste to Energy 39% 30% 35% Global e-Waste (metric tons) 321 301 243 Refurbished and Reused Material 10 0% 0% 14% Recycled Material 100% 100% 86% Global Construction Waste (metric tons) 158 1,621 3,395 Recycled/Composted Material 84% 61% 90% Landfilled Material 16% 39% 10% Waste to Energy 0% 0% 0%
 Goldman Sachs Group Sustainability Report Page 95 Page 97