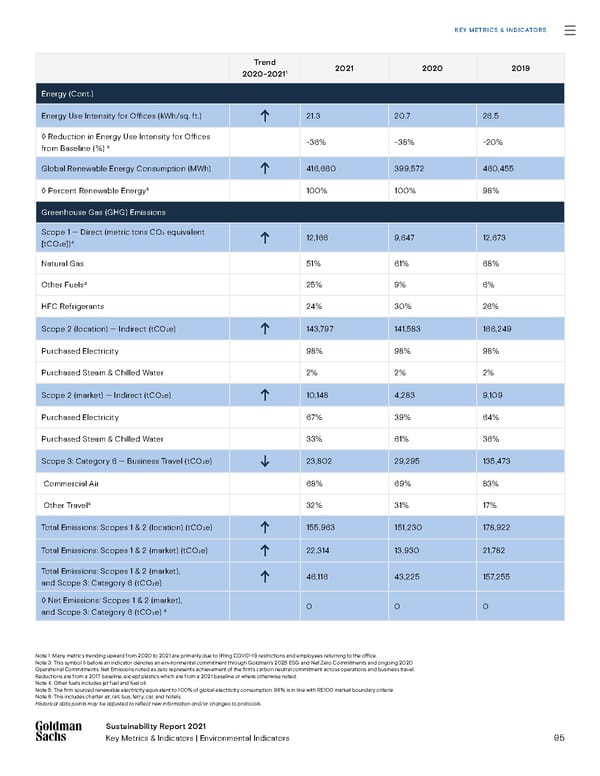
95 Sustainability Report 2021 Key Metrics & Indicators | Environmental Indicators Sustainability Report 2021 Key Metrics & Indicators KEY METRICS & INDICATORS Note 1: Many metrics trending upward from 2020 to 2021 are primarily due to lifting COVID-19 restrictions and employees returning to the office. Note 3: This symbol ◊ before an indicator denotes an environmental commitment through Goldman’s 2025 ESG and Net Zero Commitments and ongoing 2020 Operational Commitments. Net Emissions noted as zero represents achievement of the firm’s carbon neutral commitment across operations and business travel. Reductions are from a 2017 baseline, except plastics which are from a 2021 baseline or where otherwise noted. Note 4: Other fuels includes jet fuel and fuel oil. Note 5: The firm sourced renewable electricity equivalent to 100% of global electricity consumption. 96% is in line with RE100 market boundary criteria. Note 6: This includes charter air, rail, bus, ferry, car, and hotels. Historical data points may be adjusted to reflect new information and/or changes to protocols. Trend 2020-2021 1 2021 2020 2019 Energy (Cont.) Energy Use Intensity for Offices (kWh/sq. ft.) 21.3 20.7 26.5 ◊ Reduction in Energy Use Intensity for Offices from Baseline (%) 3 -36% -38% -20% Global Renewable Energy Consumption (MWh) 416,660 399,572 460,455 ◊ Percent Renewable Energy 5 100% 100% 98% Greenhouse Gas (GHG) Emissions Scope 1 — Direct (metric tons CO 2 equivalent [tCO 2e]) 4 12,166 9,647 12,673 Natural Gas 51% 61% 68% Other Fuels 4 25% 9% 6% HFC Refrigerants 24% 30% 26% Scope 2 (location) — Indirect (tCO 2e) 143,797 141,583 166,249 Purchased Electricity 98% 98% 98% Purchased Steam & Chilled Water 2% 2% 2% Scope 2 (market) — Indirect (tCO 2e) 10,148 4,283 9,109 Purchased Electricity 67% 39% 64% Purchased Steam & Chilled Water 33% 61% 36% Scope 3: Category 6 — Business Travel (tCO 2e) 23,802 29,295 135,473 Commercial Air 68% 69% 83% Other Travel 6 32% 31% 17% Total Emissions: Scopes 1 & 2 (location) (tCO 2e) 155,963 151,230 178,922 Total Emissions: Scopes 1 & 2 (market) (tCO 2e) 22,314 13,930 21,782 Total Emissions: Scopes 1 & 2 (market), and Scope 3: Category 6 (tCO 2e) 46,116 43,225 157, 255 ◊ Net Emissions: Scopes 1 & 2 (market), and Scope 3: Category 6 (tCO 2e) 3 0 0 0
 Goldman Sachs Group Sustainability Report Page 94 Page 96