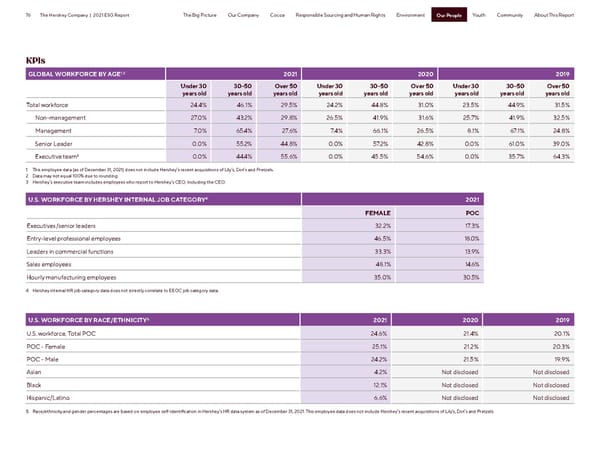
76 The Hershey Company | 2021 ESG Report The Big Picture Our Company Cocoa Responsible Sourcing and Human Rights Environment Our People Youth Community About This Report Our People KPIs GLOBAL WORKFORCE BY AGE1,2 2021 2020 2019 Under 30 30-50 Over 50 Under 30 30-50 Over 50 Under 30 30-50 Over 50 years old years old years old years old years old years old years old years old years old Total workforce 24.4% 46.1% 29.5% 24.2% 44.8% 31.0% 23.5% 44.9% 31.5% Non-management 27.0% 43.2% 29.8% 26.5% 41.9% 31.6% 25.7% 41.9% 32.5% Management 7.0% 65.4% 27.6% 7.4% 66.1% 26.5% 8.1% 67.1% 24.8% Senior Leader 0.0% 55.2% 44.8% 0.0% 57.2% 42.8% 0.0% 61.0% 39.0% Executive team3 0.0% 44.4% 55.6% 0.0% 45.5% 54.6% 0.0% 35.7% 64.3% 1 This employee data (as of December 31, 2021) does not include Hershey’s recent acquisitions of Lily’s, Dot’s and Pretzels. 2 Data may not equal 100% due to rounding. 3 Hershey’s executive team includes employees who report to Hershey’s CEO, including the CEO. 4 U.S. WORKFORCE BY HERSHEY INTERNAL JOB CATEGORY 2021 FEMALE POC Executives/senior leaders 32.2% 17.3% Entry-level professional employees 46.5% 18.0% Leaders in commercial functions 33.3% 13.9% Sales employees 48.1% 14.6% Hourly manufacturing employees 35.0% 30.5% 4 Hershey internal HR job category data does not directly correlate to EEOC job category data. 5 U.S. WORKFORCE BY RACE/ETHNICITY 2021 2020 2019 U.S. workforce, Total POC 24.6% 21.4% 20.1% POC - Female 25.1% 21.2% 20.3% POC - Male 24.2% 21.5% 19.9% Asian 4.2% Not disclosed Not disclosed Black 12.1% Not disclosed Not disclosed Hispanic/Latino 6.6% Not disclosed Not disclosed 5 Race/ethnicity and gender percentages are based on employee self-identification in Hershey’s HR data system as of December 31, 2021. This employee data does not include Hershey’s recent acquisitions of Lily’s, Dot’s and Pretzels.
 Hershey ESG Report Page 75 Page 77