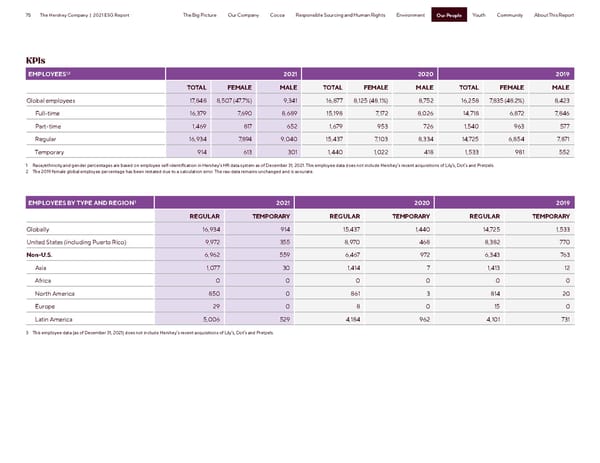
75 The Hershey Company | 2021 ESG Report The Big Picture Our Company Cocoa Responsible Sourcing and Human Rights Environment Our People Youth Community About This Report Our People KPIs 1,2 EMPLOYEES 2021 2020 2019 TOTAL FEMALE MALE TOTAL FEMALE MALE TOTAL FEMALE MALE Global employees 17,848 8,507 (47.7%) 9,341 16,877 8,125 (48.1%) 8,752 16,258 7,835 (48.2%) 8,423 Full-time 16,379 7,690 8,689 15,198 7,172 8,026 14,718 6,872 7,846 Part-time 1,469 817 652 1,679 953 726 1,540 963 577 Regular 16,934 7,894 9,040 15,437 7,103 8,334 14,725 6,854 7,871 Temporary 914 613 301 1,440 1,022 418 1,533 981 552 1 Race/ethnicity and gender percentages are based on employee self-identification in Hershey’s HR data system as of December 31, 2021. This employee data does not include Hershey’s recent acquisitions of Lily’s, Dot’s and Pretzels. 2 The 2019 female global employee percentage has been restated due to a calculation error. The raw data remains unchanged and is accurate. 3 EMPLOYEES BY TYPE AND REGION 2021 2020 2019 REGULAR TEMPORARY REGULAR TEMPORARY REGULAR TEMPORARY Globally 16,934 914 15,437 1,440 14,725 1,533 United States (including Puerto Rico) 9,972 355 8,970 468 8,382 770 Non-U.S. 6,962 559 6,467 972 6,343 763 Asia 1,077 30 1,414 7 1,413 12 Africa 0 0 0 0 0 0 North America 850 0 861 3 814 20 Europe 29 0 8 0 15 0 Latin America 5,006 529 4,184 962 4,101 731 3 This employee data (as of December 31, 2021) does not include Hershey’s recent acquisitions of Lily’s, Dot’s and Pretzels.
 Hershey ESG Report Page 74 Page 76