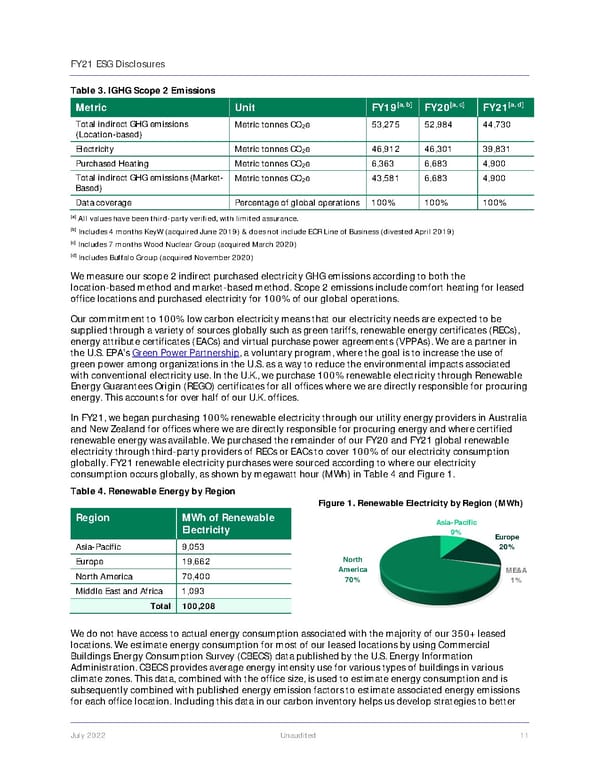
FY21 ESG Disclosures July 2022 Unaudited 11 Table 3. IGHG Scope 2 Emissions Metric Unit FY19 [a, b] FY20 [a, c] FY21 [a, d] Total indirect GHG emissions (Location-based) Metric tonnes CO 2 e 53,275 52,984 44,730 Electricity Metric tonnes CO 2 e 46,912 46,301 39,831 Purchased Heating Metric tonnes CO 2 e 6,363 6,683 4,900 Total indirect GHG emissions (Market- Based) Metric tonnes CO 2 e 43,581 6,683 4,900 Data coverage Percentage of global operations 100% 100% 100% [a] All values have been third-party verified, with limited assurance. [b] Includes 4 months KeyW (acquired June 2019) & does not include ECR Line of Business (divested April 2019) [c] Includes 7 months Wood Nuclear Group (acquired March 2020) [d] Includes Buffalo Group (acquired November 2020) We measure our scope 2 indirect purchased electricity GHG emissions according to both the location-based method and market-based method. Scope 2 emissions include comfort heating for leased office locations and purchased electricity for 100% of our global operations. Our commitment to 100% low carbon electricity means that our electricity needs are expected to be supplied through a variety of sources globally such as green tariffs, renewable energy certificates (RECs), energy attribute certificates (EACs) and virtual purchase power agreements (VPPAs). We are a partner in the U.S. EPA’s Green Power Partnership , a voluntary program, where the goal is to increase the use of green power among organizations in the U.S. as a way to reduce the environmental impacts associated with conventional electricity use. In the U.K., we purchase 100% renewable electricity through Renewable Energy Guarantees Origin (REGO) certificates for all offices where we are directly responsible for procuring energy. This accounts for over half of our U.K. offices. In FY21, we began purchasing 100% renewable electricity through our utility energy providers in Australia and New Zealand for offices where we are directly responsible for procuring energy and where certified renewable energy was available. We purchased the remainder of our FY20 and FY21 global renewable electricity through third-party providers of RECs or EACs to cover 100% of our electricity consumption globally. FY21 renewable electricity purchases were sourced according to where our electricity consumption occurs globally, as shown by megawatt hour (MWh) in Table 4 and Figure 1. Table 4. Renewable Energy by Region We do not have access to actual energy consumption associated with the majority of our 350+ leased locations. We estimate energy consumption for most of our leased locations by using Commercial Buildings Energy Consumption Survey (CBECS) data published by the U.S. Energy Information Administration. CBECS provides average energy intensity use for various types of buildings in various climate zones. This data, combined with the office size, is used to estimate energy consumption and is subsequently combined with published energy emission factors to estimate associated energy emissions for each office location. Including this data in our carbon inventory helps us develop strategies to better Region MWh of Renewable Electricity Asia-Pacific 9,053 Europe 19,662 North America 70,400 Middle East and Africa 1,093 Total 100,208 Asia-Pacific 9% Europe 20% ME&A 1% North America 70% Figure 1. Renewable Electricity by Region (MWh)
 Jacobs Engineering Group ESG Disclosures Page 11 Page 13