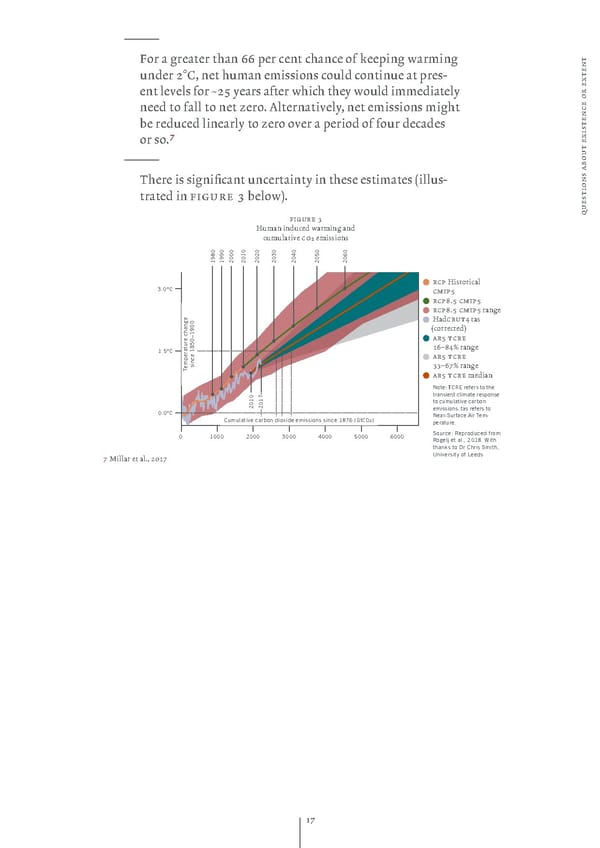
— Žor a reater than ŸŸ per cent chance of ƒeepin warmin t n under 2°C net human emissions could continue at pres„ e xt ent leels for ¬2” ears after which the would immediatel r e e o need to fall to net zero‚ lternatiel net emissions miht c n e be reduced linearl to zero oer a period of four decades t s i or so‚& x t e u — o b s a …here is sinificant uncertaint in these estimates ›illus„ n o i t trated in figure 3 belowœ‚ s e u q figure 3 Human induced warmin and cumulatie co2 emissions 1980 1990 2000 2010 2020 2030 2040 2050 2060 rcp Historical 3.0°C cmip” rcp8.5 cmip” rcp8.5 cmip” rane Hadcrut‘ tas 900 ›correctedœ ar5 tcre 1.5°C 1Ÿ–—‘® rane ar5 tcre emperature changesince 1850–1 –Ÿ¡® rane T ar5 tcre median Note: TCRE refers to the transient climate response to cumulative carbon 2010 2017 emissions. tas refers to 0.0°C Near-Surface Air Tem- Cumulative carbon dioxide emissions since 1876 (GtCO2) perature. 0 1000 2000 3000 4000 5000 6000 Source: Reproduced from Rogelj et al., 2018. With thanks to Dr Chris Smith, ¡ Millar et al‚ 201¡ University of Leeds 1¡
 Pictet Group Oxford Climate Change Study Page 16 Page 18