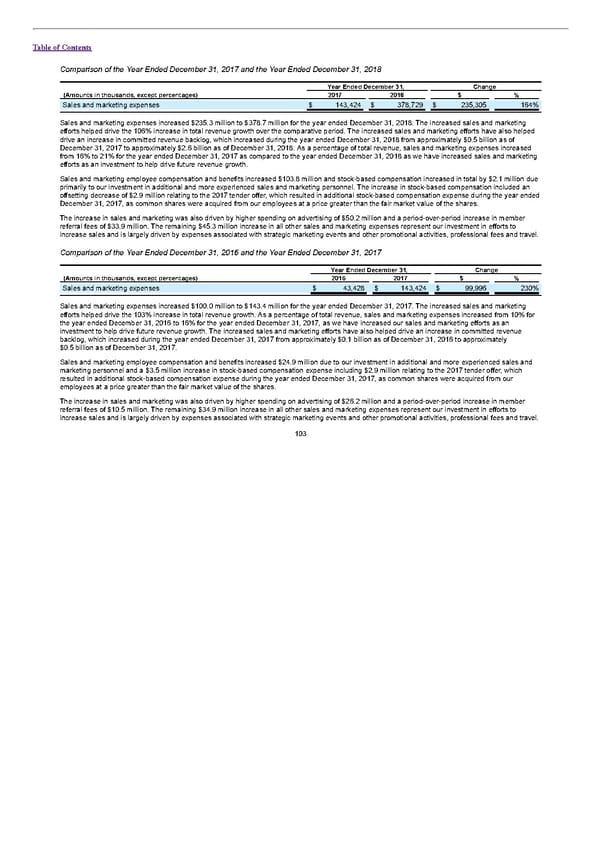
Table of Contents Comparison of the Year Ended December 31, 2017 and the Year Ended December 31, 2018 Year Ended December 31, Change (Amounts in thousands, except percentages) 2017 2018 $ % Sales and marketing expenses $ 143,424 $ 378,729 $ 235,305 164% Sales and marketing expenses increased $235.3 million to $378.7 million for the year ended December 31, 2018. The increased sales and marketing efforts helped drive the 106% increase in total revenue growth over the comparative period. The increased sales and marketing efforts have also helped drive an increase in committed revenue backlog, which increased during the year ended December 31, 2018 from approximately $0.5 billion as of December 31, 2017 to approximately $2.6 billion as of December 31, 2018. As a percentage of total revenue, sales and marketing expenses increased from 16% to 21% for the year ended December 31, 2017 as compared to the year ended December 31, 2018 as we have increased sales and marketing efforts as an investment to help drive future revenue growth. Sales and marketing employee compensation and benefits increased $103.8 million and stock-based compensation increased in total by $2.1 million due primarily to our investment in additional and more experienced sales and marketing personnel. The increase in stock-based compensation included an offsetting decrease of $2.9 million relating to the 2017 tender offer, which resulted in additional stock-based compensation expense during the year ended December 31, 2017, as common shares were acquired from our employees at a price greater than the fair market value of the shares. The increase in sales and marketing was also driven by higher spending on advertising of $50.2 million and a period-over-period increase in member referral fees of $33.9 million. The remaining $45.3 million increase in all other sales and marketing expenses represent our investment in efforts to increase sales and is largely driven by expenses associated with strategic marketing events and other promotional activities, professional fees and travel. Comparison of the Year Ended December 31, 2016 and the Year Ended December 31, 2017 Year Ended December 31, Change (Amounts in thousands, except percentages) 2016 2017 $ % Sales and marketing expenses $ 43,428 $ 143,424 $ 99,996 230% Sales and marketing expenses increased $100.0 million to $143.4 million for the year ended December 31, 2017. The increased sales and marketing efforts helped drive the 103% increase in total revenue growth. As a percentage of total revenue, sales and marketing expenses increased from 10% for the year ended December 31, 2016 to 16% for the year ended December 31, 2017, as we have increased our sales and marketing efforts as an investment to help drive future revenue growth. The increased sales and marketing efforts have also helped drive an increase in committed revenue backlog, which increased during the year ended December 31, 2017 from approximately $0.1 billion as of December 31, 2016 to approximately $0.5 billion as of December 31, 2017. Sales and marketing employee compensation and benefits increased $24.9 million due to our investment in additional and more experienced sales and marketing personnel and a $3.5 million increase in stock-based compensation expense including $2.9 million relating to the 2017 tender offer, which resulted in additional stock-based compensation expense during the year ended December 31, 2017, as common shares were acquired from our employees at a price greater than the fair market value of the shares. The increase in sales and marketing was also driven by higher spending on advertising of $26.2 million and a period-over-period increase in member referral fees of $10.5 million. The remaining $34.9 million increase in all other sales and marketing expenses represent our investment in efforts to increase sales and is largely driven by expenses associated with strategic marketing events and other promotional activities, professional fees and travel. 103
 S1 - WeWork Prospectus Page 107 Page 109