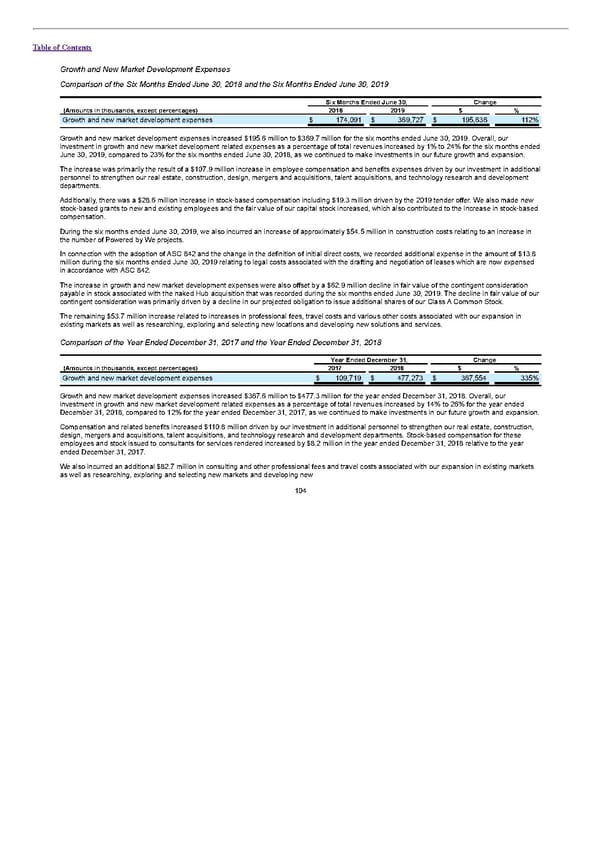
Table of Contents Growth and New Market Development Expenses Comparison of the Six Months Ended June 30, 2018 and the Six Months Ended June 30, 2019 Six Months Ended June 30, Change (Amounts in thousands, except percentages) 2018 2019 $ % Growth and new market development expenses $ 174,091 $ 369,727 $ 195,636 112% Growth and new market development expenses increased $195.6 million to $369.7 million for the six months ended June 30, 2019. Overall, our investment in growth and new market development related expenses as a percentage of total revenues increased by 1% to 24% for the six months ended June 30, 2019, compared to 23% for the six months ended June 30, 2018, as we continued to make investments in our future growth and expansion. The increase was primarily the result of a $107.9 million increase in employee compensation and benefits expenses driven by our investment in additional personnel to strengthen our real estate, construction, design, mergers and acquisitions, talent acquisitions, and technology research and development departments. Additionally, there was a $28.6 million increase in stock-based compensation including $19.3 million driven by the 2019 tender offer. We also made new stock-based grants to new and existing employees and the fair value of our capital stock increased, which also contributed to the increase in stock-based compensation. During the six months ended June 30, 2019, we also incurred an increase of approximately $54.5 million in construction costs relating to an increase in the number of Powered by We projects. In connection with the adoption of ASC 842 and the change in the definition of initial direct costs, we recorded additional expense in the amount of $13.8 million during the six months ended June 30, 2019 relating to legal costs associated with the drafting and negotiation of leases which are now expensed in accordance with ASC 842. The increase in growth and new market development expenses were also offset by a $62.9 million decline in fair value of the contingent consideration payable in stock associated with the naked Hub acquisition that was recorded during the six months ended June 30, 2019. The decline in fair value of our contingent consideration was primarily driven by a decline in our projected obligation to issue additional shares of our Class A Common Stock. The remaining $53.7 million increase related to increases in professional fees, travel costs and various other costs associated with our expansion in existing markets as well as researching, exploring and selecting new locations and developing new solutions and services. Comparison of the Year Ended December 31, 2017 and the Year Ended December 31, 2018 Year Ended December 31, Change (Amounts in thousands, except percentages) 2017 2018 $ % Growth and new market development expenses $ 109,719 $ 477,273 $ 367,554 335% Growth and new market development expenses increased $367.6 million to $477.3 million for the year ended December 31, 2018. Overall, our investment in growth and new market development related expenses as a percentage of total revenues increased by 14% to 26% for the year ended December 31, 2018, compared to 12% for the year ended December 31, 2017, as we continued to make investments in our future growth and expansion. Compensation and related benefits increased $110.8 million driven by our investment in additional personnel to strengthen our real estate, construction, design, mergers and acquisitions, talent acquisitions, and technology research and development departments. Stock-based compensation for these employees and stock issued to consultants for services rendered increased by $8.2 million in the year ended December 31, 2018 relative to the year ended December 31, 2017. We also incurred an additional $82.7 million in consulting and other professional fees and travel costs associated with our expansion in existing markets as well as researching, exploring and selecting new markets and developing new 104
 S1 - WeWork Prospectus Page 108 Page 110