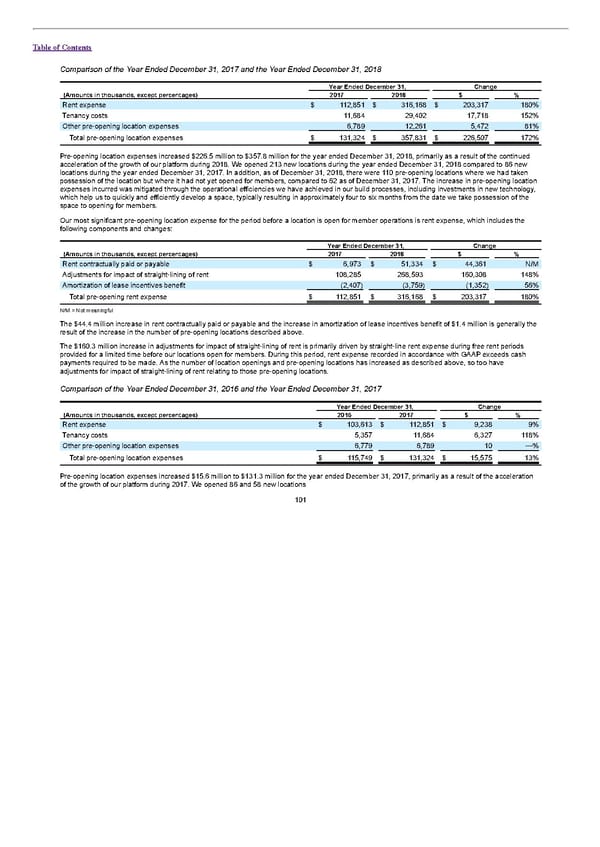
Table of Contents Comparison of the Year Ended December 31, 2017 and the Year Ended December 31, 2018 Year Ended December 31, Change (Amounts in thousands, except percentages) 2017 2018 $ % Rent expense $ 112,851 $ 316,168 $ 203,317 180% Tenancy costs 11,684 29,402 17,718 152% Other pre-opening location expenses 6,789 12,261 5,472 81% Total pre-opening location expenses $ 131,324 $ 357,831 $ 226,507 172% Pre-opening location expenses increased $226.5 million to $357.8 million for the year ended December 31, 2018, primarily as a result of the continued acceleration of the growth of our platform during 2018. We opened 213 new locations during the year ended December 31, 2018 compared to 86 new locations during the year ended December 31, 2017. In addition, as of December 31, 2018, there were 110 pre-opening locations where we had taken possession of the location but where it had not yet opened for members, compared to 62 as of December 31, 2017. The increase in pre-opening location expenses incurred was mitigated through the operational efficiencies we have achieved in our build processes, including investments in new technology, which help us to quickly and efficiently develop a space, typically resulting in approximately four to six months from the date we take possession of the space to opening for members. Our most significant pre-opening location expense for the period before a location is open for member operations is rent expense, which includes the following components and changes: Year Ended December 31, Change (Amounts in thousands, except percentages) 2017 2018 $ % Rent contractually paid or payable $ 6,973 $ 51,334 $ 44,361 N/M Adjustments for impact of straight-lining of rent 108,285 268,593 160,308 148% Amortization of lease incentives benefit (2,407) (3,759) (1,352) 56% Total pre-opening rent expense $ 112,851 $ 316,168 $ 203,317 180% N/M = Not meaningful The $44.4 million increase in rent contractually paid or payable and the increase in amortization of lease incentives benefit of $1.4 million is generally the result of the increase in the number of pre-opening locations described above. The $160.3 million increase in adjustments for impact of straight-lining of rent is primarily driven by straight-line rent expense during free rent periods provided for a limited time before our locations open for members. During this period, rent expense recorded in accordance with GAAP exceeds cash payments required to be made. As the number of location openings and pre-opening locations has increased as described above, so too have adjustments for impact of straight-lining of rent relating to those pre-opening locations. Comparison of the Year Ended December 31, 2016 and the Year Ended December 31, 2017 Year Ended December 31, Change (Amounts in thousands, except percentages) 2016 2017 $ % Rent expense $ 103,613 $ 112,851 $ 9,238 9% Tenancy costs 5,357 11,684 6,327 118% Other pre-opening location expenses 6,779 6,789 10 —% Total pre-opening location expenses $ 115,749 $ 131,324 $ 15,575 13% Pre-opening location expenses increased $15.6 million to $131.3 million for the year ended December 31, 2017, primarily as a result of the acceleration of the growth of our platform during 2017. We opened 86 and 58 new locations 101
 S1 - WeWork Prospectus Page 105 Page 107