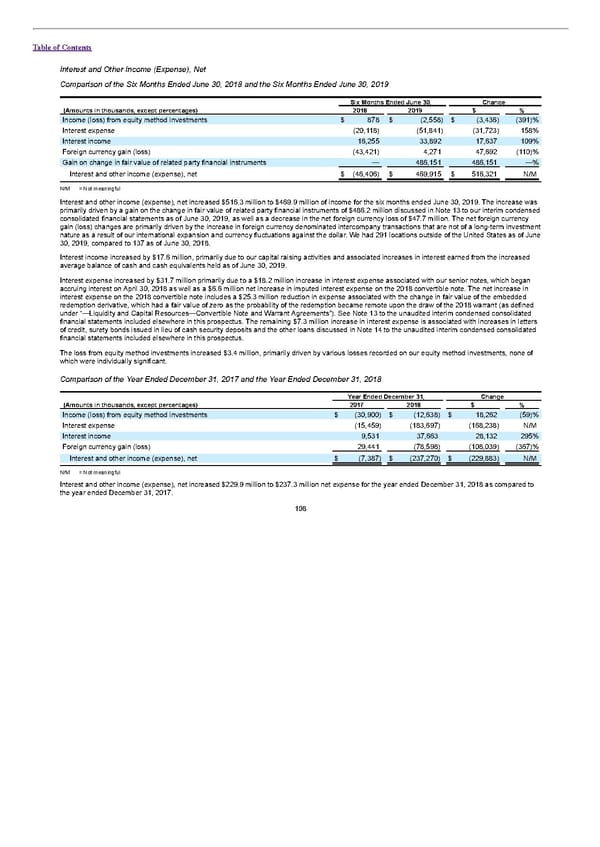
Table of Contents Interest and Other Income (Expense), Net Comparison of the Six Months Ended June 30, 2018 and the Six Months Ended June 30, 2019 Six Months Ended June 30, Change (Amounts in thousands, except percentages) 2018 2019 $ % Income (loss) from equity method investments $ 878 $ (2,558) $ (3,436) (391)% Interest expense (20,118) (51,841) (31,723) 158% Interest income 16,255 33,892 17,637 109% Foreign currency gain (loss) (43,421) 4,271 47,692 (110)% Gain on change in fair value of related party financial instruments — 486,151 486,151 —% Interest and other income (expense), net $ (46,406) $ 469,915 $ 516,321 N/M N/M = Not meaningful Interest and other income (expense), net increased $516.3 million to $469.9 million of income for the six months ended June 30, 2019. The increase was primarily driven by a gain on the change in fair value of related party financial instruments of $486.2 million discussed in Note 13 to our interim condensed consolidated financial statements as of June 30, 2019, as well as a decrease in the net foreign currency loss of $47.7 million. The net foreign currency gain (loss) changes are primarily driven by the increase in foreign currency denominated intercompany transactions that are not of a long-term investment nature as a result of our international expansion and currency fluctuations against the dollar. We had 291 locations outside of the United States as of June 30, 2019, compared to 137 as of June 30, 2018. Interest income increased by $17.6 million, primarily due to our capital raising activities and associated increases in interest earned from the increased average balance of cash and cash equivalents held as of June 30, 2019. Interest expense increased by $31.7 million primarily due to a $18.2 million increase in interest expense associated with our senior notes, which began accruing interest on April 30, 2018 as well as a $6.6 million net increase in imputed interest expense on the 2018 convertible note. The net increase in interest expense on the 2018 convertible note includes a $25.3 million reduction in expense associated with the change in fair value of the embedded redemption derivative, which had a fair value of zero as the probability of the redemption became remote upon the draw of the 2018 warrant (as defined under “—Liquidity and Capital Resources—Convertible Note and Warrant Agreements”). See Note 13 to the unaudited interim condensed consolidated financial statements included elsewhere in this prospectus. The remaining $7.3 million increase in interest expense is associated with increases in letters of credit, surety bonds issued in lieu of cash security deposits and the other loans discussed in Note 14 to the unaudited interim condensed consolidated financial statements included elsewhere in this prospectus. The loss from equity method investments increased $3.4 million, primarily driven by various losses recorded on our equity method investments, none of which were individually significant. Comparison of the Year Ended December 31, 2017 and the Year Ended December 31, 2018 Year Ended December 31, Change (Amounts in thousands, except percentages) 2017 2018 $ % Income (loss) from equity method investments $ (30,900) $ (12,638) $ 18,262 (59)% Interest expense (15,459) (183,697) (168,238) N/M Interest income 9,531 37,663 28,132 295% Foreign currency gain (loss) 29,441 (78,598) (108,039) (367)% Interest and other income (expense), net $ (7,387) $ (237,270) $ (229,883) N/M N/M = Not meaningful Interest and other income (expense), net increased $229.9 million to $237.3 million net expense for the year ended December 31, 2018 as compared to the year ended December 31, 2017. 108
 S1 - WeWork Prospectus Page 112 Page 114