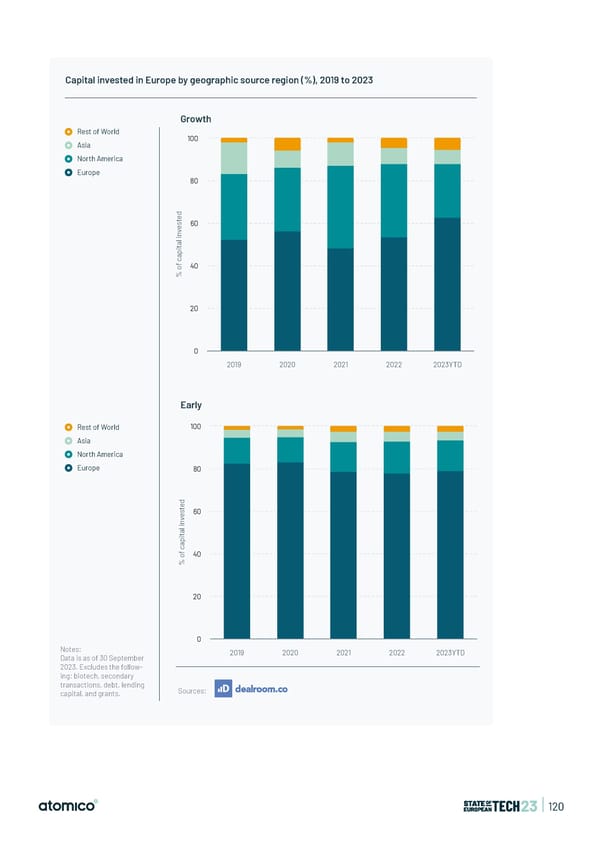
Capital invested in Europe by geographic source region (%), 2019 to 2023 Growth Rest of World 100 Asia North America Europe 80 d e t s 60 e v n i l a t i p a c f 40 o % 20 0 2019 2020 2021 2022 2023YTD Early Rest of World 100 Asia North America Europe 80 d e t s 60 e v n i l a t i p a c f 40 o % 20 0 Notes: 2019 2020 2021 2022 2023YTD Data is as of 30 September 2023. Excludes the follow- ing: biotech, secondary transactions, debt, lending Sources: capital, and grants. | 120
 State of European Tech | 2023 Page 119 Page 121