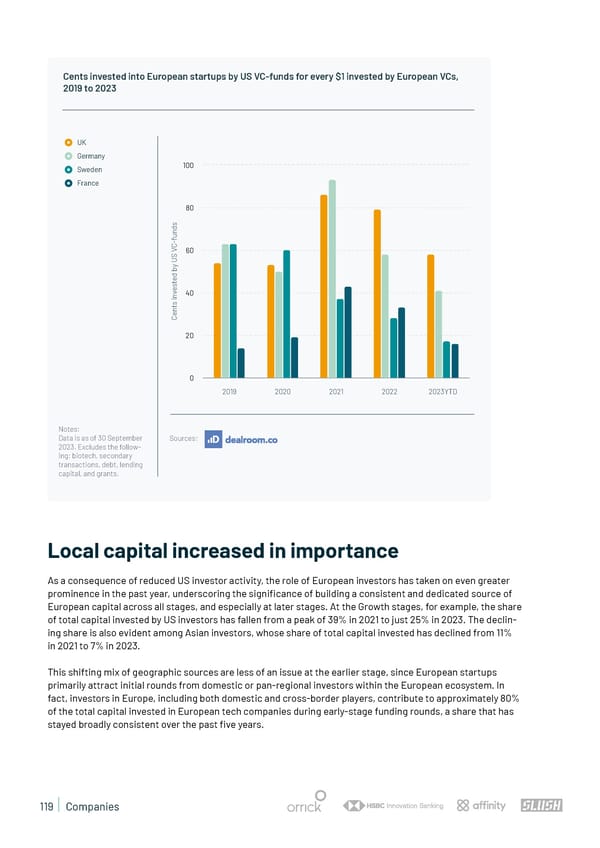
Cents invested into European startups by US VC-funds for every $1 invested by European VCs, 2019 to 2023 UK Germany Sweden 100 France 80 s d n u f - C V 60 S U y b d e t s e v 40 n i s t n e C 20 0 2019 2020 2021 2022 2023YTD Notes: Data is as of 30 September Sources: 2023. Excludes the follow- ing: biotech, secondary transactions, debt, lending capital, and grants. Local capital increased in importance As a consequence of reduced US investor activity, the role of European investors has taken on even greater prominence in the past year, underscoring the signi昀椀cance of building a consistent and dedicated source of European capital across all stages, and especially at later stages. At the Growth stages, for example, the share of total capital invested by US investors has fallen from a peak of 39% in 2021 to just 25% in 2023. The declin- ing share is also evident among Asian investors, whose share of total capital invested has declined from 11% in 2021 to 7% in 2023. This shifting mix of geographic sources are less of an issue at the earlier stage, since European startups primarily attract initial rounds from domestic or pan-regional investors within the European ecosystem. In fact, investors in Europe, including both domestic and cross-border players, contribute to approximately 80% of the total capital invested in European tech companies during early-stage funding rounds, a share that has stayed broadly consistent over the past 昀椀ve years. 119 | Companies
 State of European Tech | 2023 Page 118 Page 120