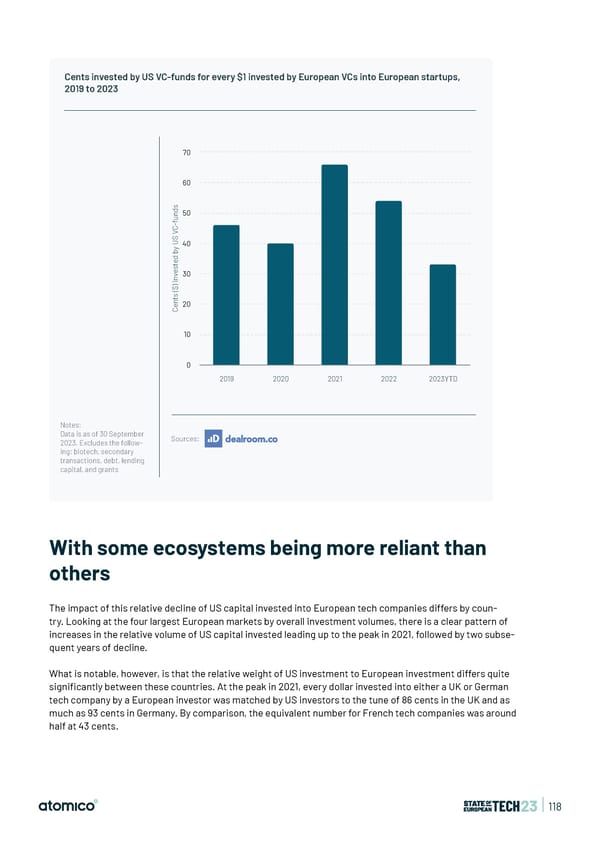
Cents invested by US VC-funds for every $1 invested by European VCs into European startups, 2019 to 2023 70 60 s d50 n u f - C V S U40 y b d e t s e30 v n i ) $ ( s t n20 e C 10 0 2019 2020 2021 2022 2023YTD Notes: Data is as of 30 September Sources: 2023. Excludes the follow- ing: biotech, secondary transactions, debt, lending capital, and grants With some ecosystems being more reliant than others The impact of this relative decline of US capital invested into European tech companies differs by coun- try. Looking at the four largest European markets by overall investment volumes, there is a clear pattern of increases in the relative volume of US capital invested leading up to the peak in 2021, followed by two subse- quent years of decline. What is notable, however, is that the relative weight of US investment to European investment differs quite signi昀椀cantly between these countries. At the peak in 2021, every dollar invested into either a UK or German tech company by a European investor was matched by US investors to the tune of 86 cents in the UK and as much as 93 cents in Germany. By comparison, the equivalent number for French tech companies was around half at 43 cents. | 118
 State of European Tech | 2023 Page 117 Page 119