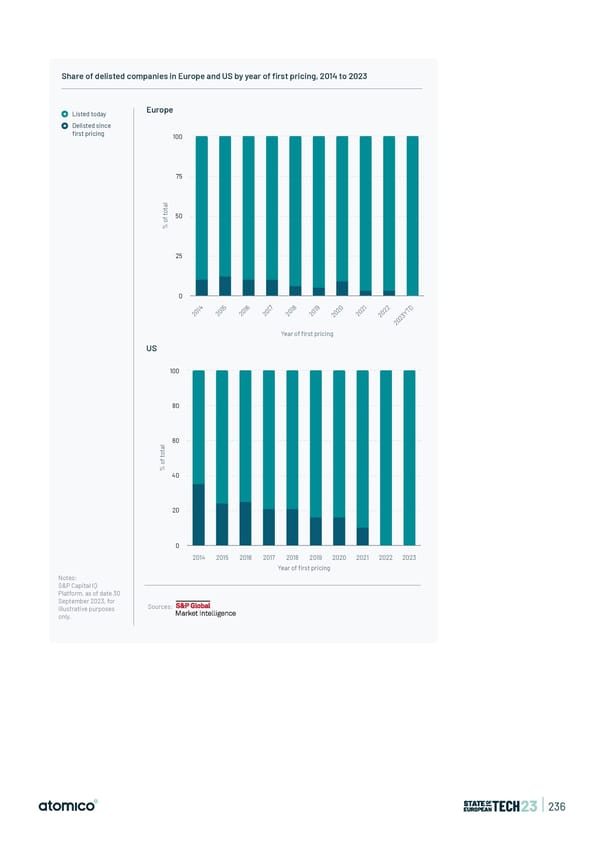
Share of delisted companies in Europe and US by year of first pricing, 2014 to 2023 Listed today Europe Delisted since first pricing 100 75 l a t o t 50 f o % 25 0 4 5 6 7 8 9 0 1 2 D 1 1 1 1 1 1 2 2 2 T 20 20 20 20 20 20 20 20 20 3Y 2 20 Year of first pricing US 100 80 l 60 a t o t f o % 40 20 0 2014 2015 2016 2017 2018 2019 2020 2021 2022 2023 Year of first pricing Notes: S&P Capital IQ Platform, as of date 30 September 2023, for Sources: illustrative purposes only. | 236
 State of European Tech | 2023 Page 235 Page 237