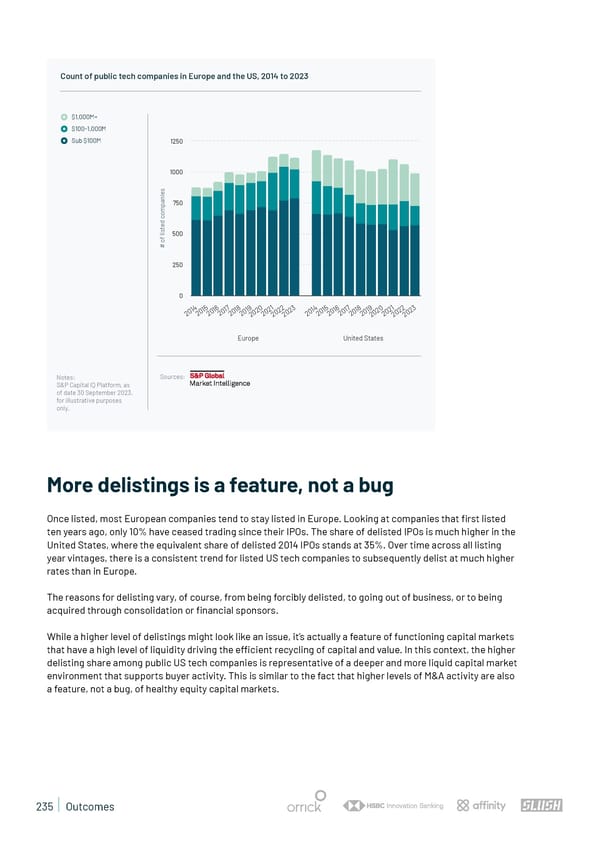
Count of public tech companies in Europe and the US, 2014 to 2023 $1,000M+ $100-1,000M Sub $100M 1250 1000 s e i n a 750 p m o c d e t s i l 500 f o # 250 0 4 5 6 7 8 9 0 1 2 3 4 5 6 7 8 9 0 1 2 3 1 1 1 1 1 1 2 2 2 2 1 1 1 1 1 1 2 2 2 2 20 20 20 20 20 20 20 20 20 20 20 20 20 20 20 20 20 20 20 20 Europe United States Notes: Sources: S&P Capital IQ Platform, as of date 30 September 2023, for illustrative purposes only. More delistings is a feature, not a bug Once listed, most European companies tend to stay listed in Europe. Looking at companies that 昀椀rst listed ten years ago, only 10% have ceased trading since their IPOs. The share of delisted IPOs is much higher in the United States, where the equivalent share of delisted 2014 IPOs stands at 35%. Over time across all listing year vintages, there is a consistent trend for listed US tech companies to subsequently delist at much higher rates than in Europe. The reasons for delisting vary, of course, from being forcibly delisted, to going out of business, or to being acquired through consolidation or 昀椀nancial sponsors. While a higher level of delistings might look like an issue, it’s actually a feature of functioning capital markets that have a high level of liquidity driving the e昀케cient recycling of capital and value. In this context, the higher delisting share among public US tech companies is representative of a deeper and more liquid capital market environment that supports buyer activity. This is similar to the fact that higher levels of M&A activity are also a feature, not a bug, of healthy equity capital markets. 235 | Outcomes
 State of European Tech | 2023 Page 234 Page 236