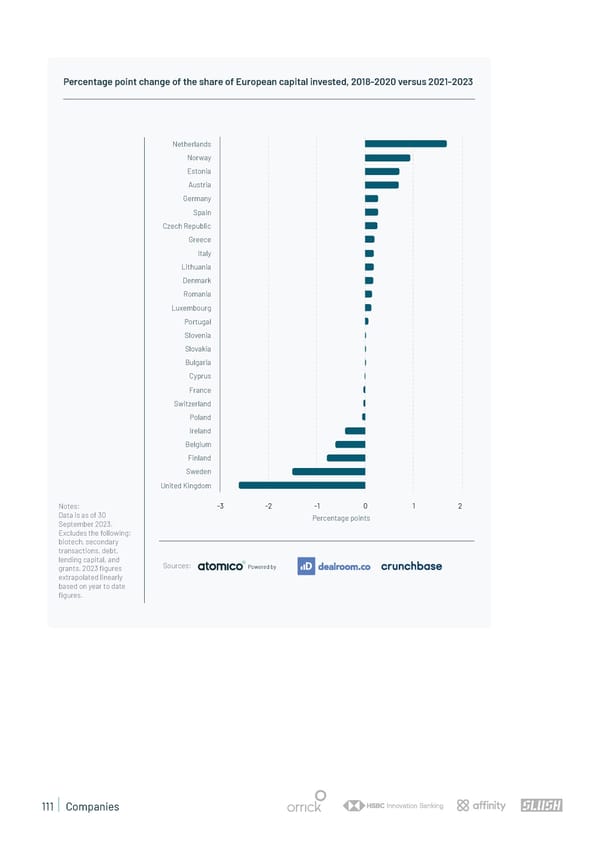
Percentage point change of the share of European capital invested, 2018-2020 versus 2021-2023 Netherlands Norway Estonia Austria Germany Spain Czech Republic Greece Italy Lithuania Denmark Romania Luxembourg Portugal Slovenia Slovakia Bulgaria Cyprus France Switzerland Poland Ireland Belgium Finland Sweden United Kingdom Notes: -3 -2 -1 0 1 2 Data is as of 30 Percentage points September 2023. Excludes the following: biotech, secondary transactions, debt, lending capital, and Sources: Powered by grants. 2023 figures extrapolated linearly based on year to date figures. 111 | Companies
 State of European Tech | 2023 Page 110 Page 112