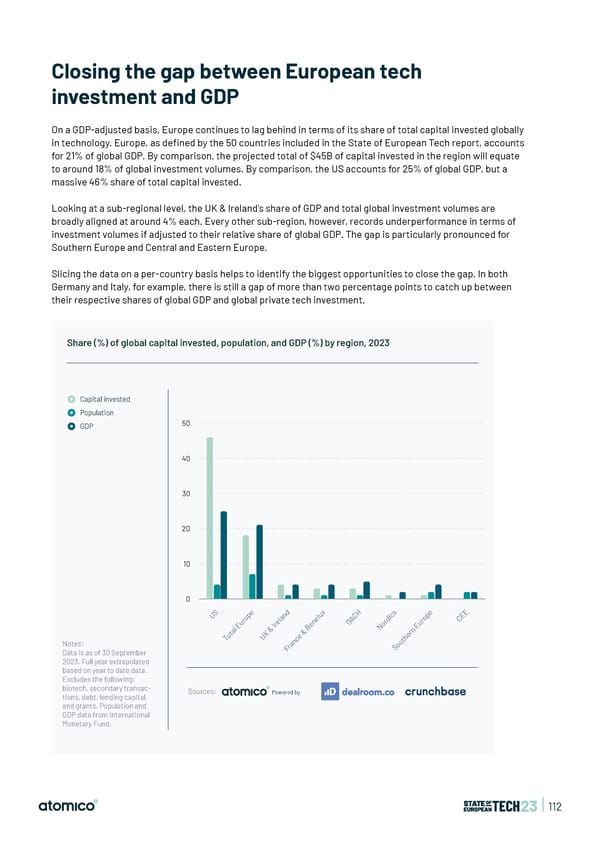
Closing the gap between European tech investment and GDP On a GDP-adjusted basis, Europe continues to lag behind in terms of its share of total capital invested globally in technology. Europe, as de昀椀ned by the 50 countries included in the State of European Tech report, accounts for 21% of global GDP. By comparison, the projected total of $45B of capital invested in the region will equate to around 18% of global investment volumes. By comparison, the US accounts for 25% of global GDP, but a massive 46% share of total capital invested. Looking at a sub-regional level, the UK & Ireland’s share of GDP and total global investment volumes are broadly aligned at around 4% each. Every other sub-region, however, records underperformance in terms of investment volumes if adjusted to their relative share of global GDP. The gap is particularly pronounced for Southern Europe and Central and Eastern Europe. Slicing the data on a per-country basis helps to identify the biggest opportunities to close the gap. In both Germany and Italy, for example, there is still a gap of more than two percentage points to catch up between their respective shares of global GDP and global private tech investment. Share (%) of global capital invested, population, and GDP (%) by region, 2023 Capital invested Population GDP 50 40 30 20 10 0 S e d x H s e E U p an lu C ic p E o l e A d o C r e n D r r u Ir e o u E B N E l & n ta K & r o U e e T c h Notes: n ut a o r S Data is as of 30 September F 2023. Full year extrapolated based on year to date data. Excludes the following: biotech, secondary transac- Sources: Powered by tions, debt, lending capital, and grants. Population and GDP data from International Monetary Fund. | 112
 State of European Tech | 2023 Page 111 Page 113