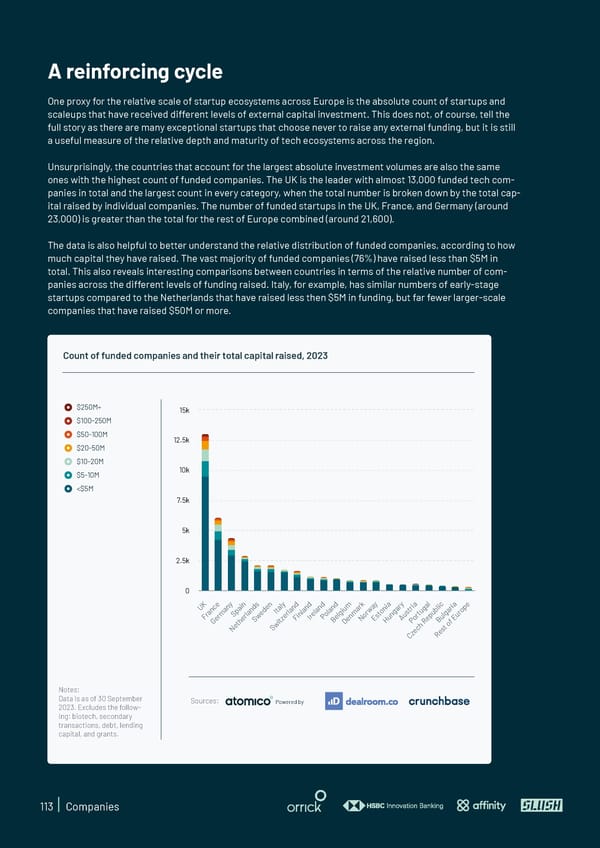
A reinforcing cycle One proxy for the relative scale of startup ecosystems across Europe is the absolute count of startups and scaleups that have received different levels of external capital investment. This does not, of course, tell the full story as there are many exceptional startups that choose never to raise any external funding, but it is still a useful measure of the relative depth and maturity of tech ecosystems across the region. Unsurprisingly, the countries that account for the largest absolute investment volumes are also the same ones with the highest count of funded companies. The UK is the leader with almost 13,000 funded tech com- panies in total and the largest count in every category, when the total number is broken down by the total cap- ital raised by individual companies. The number of funded startups in the UK, France, and Germany (around 23,000) is greater than the total for the rest of Europe combined (around 21,600). The data is also helpful to better understand the relative distribution of funded companies, according to how much capital they have raised. The vast majority of funded companies (76%) have raised less than $5M in total. This also reveals interesting comparisons between countries in terms of the relative number of com- panies across the different levels of funding raised. Italy, for example, has similar numbers of early-stage startups compared to the Netherlands that have raised less then $5M in funding, but far fewer larger-scale companies that have raised $50M or more. Count of funded companies and their total capital raised, 2023 $250M+ 15k $100-250M $50-100M 12.5k $20-50M $10-20M $5-10M 10k
 State of European Tech | 2023 Page 112 Page 114