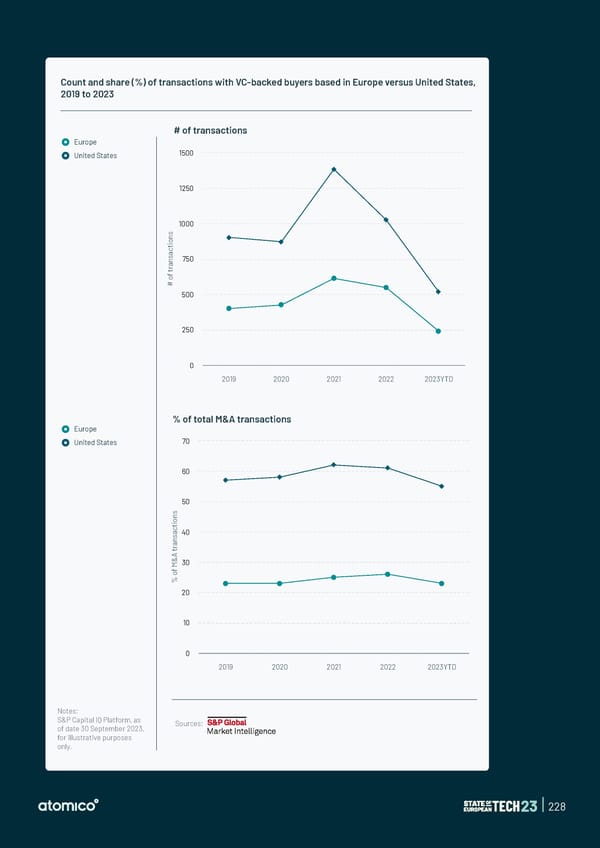
Count and share (%) of transactions with VC-backed buyers based in Europe versus United States, 2019 to 2023 # of transactions Europe United States 1500 1250 1000 s n o i t c a s 750 n a r t f o # 500 250 0 2019 2020 2021 2022 2023YTD % of total M&A transactions Europe United States 70 60 50 s n o i t c a40 s n a r t A & 30 M f o % 20 10 0 2019 2020 2021 2022 2023YTD Notes: S&P Capital IQ Platform, as Sources: of date 30 September 2023, for illustrative purposes only. | 228
 State of European Tech | 2023 Page 227 Page 229