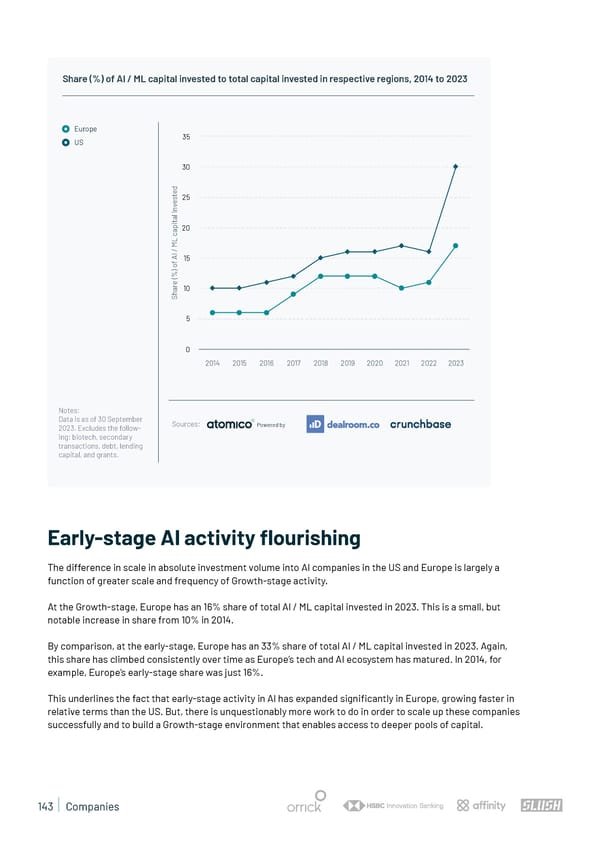
Share (%) of AI / ML capital invested to total capital invested in respective regions, 2014 to 2023 Europe US 35 30 d e t25 s e v n i l a t i p20 a c L M / I A 15 f o ) % ( e r 10 a h S 5 0 2014 2015 2016 2017 2018 2019 2020 2021 2022 2023 Notes: Data is as of 30 September Sources: Powered by 2023. Excludes the follow- ing: biotech, secondary transactions, debt, lending capital, and grants. Early-stage AI activity 昀氀ourishing The difference in scale in absolute investment volume into AI companies in the US and Europe is largely a function of greater scale and frequency of Growth-stage activity. At the Growth-stage, Europe has an 16% share of total AI / ML capital invested in 2023. This is a small, but notable increase in share from 10% in 2014. By comparison, at the early-stage, Europe has an 33% share of total AI / ML capital invested in 2023. Again, this share has climbed consistently over time as Europe’s tech and AI ecosystem has matured. In 2014, for example, Europe’s early-stage share was just 16%. This underlines the fact that early-stage activity in AI has expanded signi昀椀cantly in Europe, growing faster in relative terms than the US. But, there is unquestionably more work to do in order to scale up these companies successfully and to build a Growth-stage environment that enables access to deeper pools of capital. 143 | Companies
 State of European Tech | 2023 Page 142 Page 144