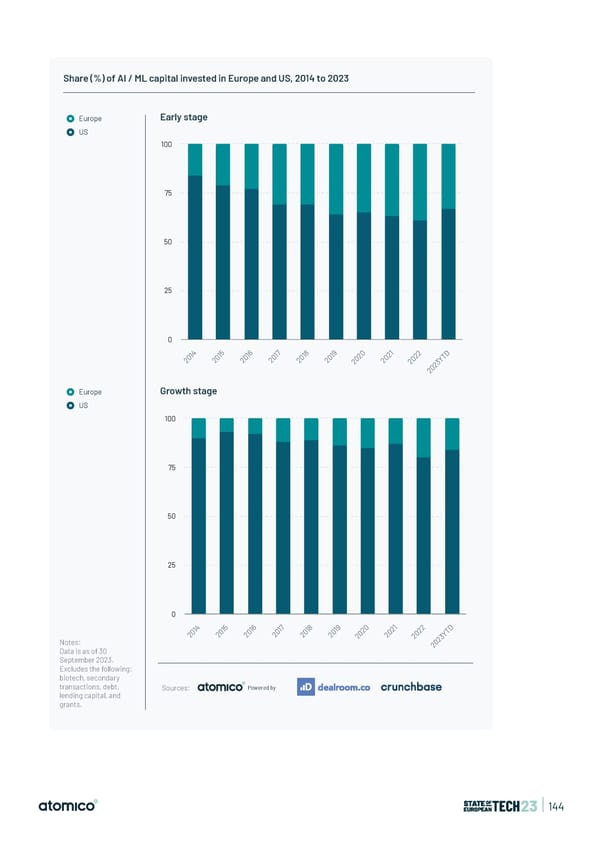
Share (%) of AI / ML capital invested in Europe and US, 2014 to 2023 Europe Early stage US 100 75 50 25 0 4 5 6 17 8 9 0 1 2 D 1 1 1 0 1 1 2 2 2 T 0 0 0 2 0 0 0 0 0 Y 2 2 2 2 2 2 2 2 3 2 0 2 Europe Growth stage US 100 75 50 25 0 4 15 6 17 8 9 0 1 2 D 1 0 1 0 1 1 2 2 2 T 0 2 20 2 0 0 0 0 0 Y 2 2 2 2 2 2 3 Notes: 2 0 Data is as of 30 2 September 2023. Excludes the following: biotech, secondary transactions, debt, Sources: Powered by lending capital, and grants. | 144
 State of European Tech | 2023 Page 143 Page 145