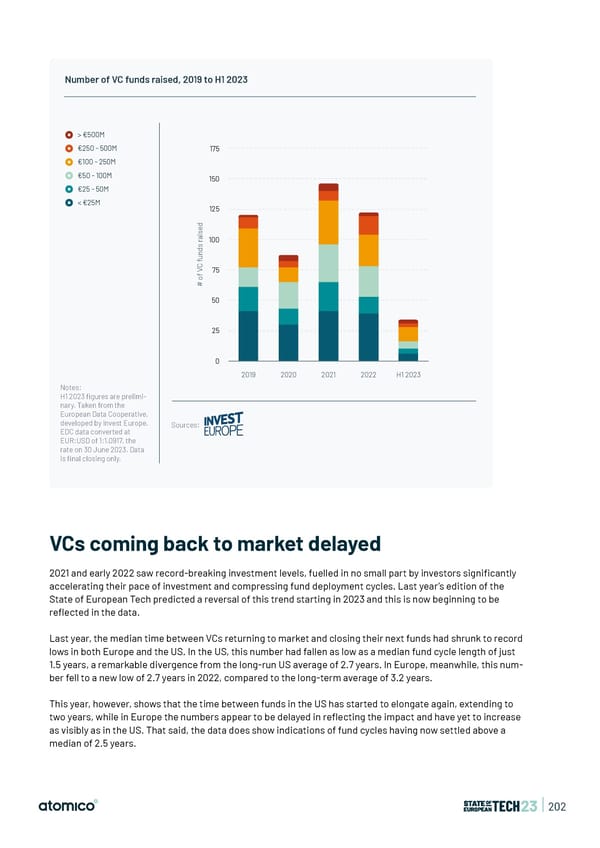
Number of VC funds raised, 2019 to H1 2023 > €500M €250 - 500M 175 €100 - 250M €50 - 100M 150 €25 - 50M < €25M 125 d e s i a r100 s d n u f C V 75 f o # 50 25 0 2019 2020 2021 2022 H1 2023 Notes: H1 2023 figures are prelimi- nary. Taken from the European Data Cooperative, developed by Invest Europe. Sources: EDC data converted at EUR:USD of 1:1.0917, the rate on 30 June 2023. Data is final closing only. VCs coming back to market delayed 2021 and early 2022 saw record-breaking investment levels, fuelled in no small part by investors signi昀椀cantly accelerating their pace of investment and compressing fund deployment cycles. Last year’s edition of the State of European Tech predicted a reversal of this trend starting in 2023 and this is now beginning to be re昀氀ected in the data. Last year, the median time between VCs returning to market and closing their next funds had shrunk to record lows in both Europe and the US. In the US, this number had fallen as low as a median fund cycle length of just 1.5 years, a remarkable divergence from the long-run US average of 2.7 years. In Europe, meanwhile, this num- ber fell to a new low of 2.7 years in 2022, compared to the long-term average of 3.2 years. This year, however, shows that the time between funds in the US has started to elongate again, extending to two years, while in Europe the numbers appear to be delayed in re昀氀ecting the impact and have yet to increase as visibly as in the US. That said, the data does show indications of fund cycles having now settled above a median of 2.5 years. | 202
 State of European Tech | 2023 Page 201 Page 203