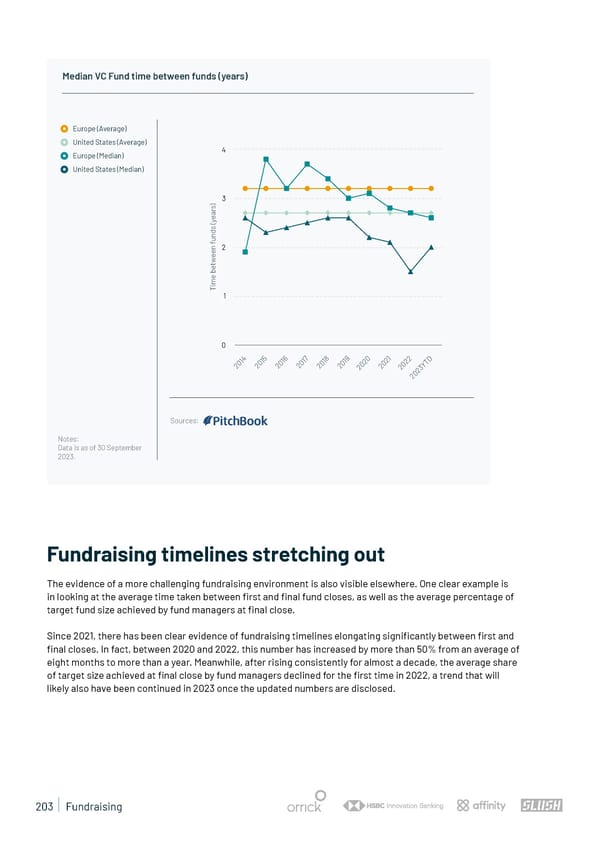
Median VC Fund time between funds (years) Europe (Average) United States (Average) Europe (Median) 4 United States (Median) )3 s r a e y ( s d n u f n2 e e w t e b e m i T1 0 4 5 6 7 8 9 0 1 2 D 1 1 1 1 1 1 2 2 2 T 0 0 0 20 0 0 0 0 0 Y 2 2 2 2 2 2 2 2 3 2 0 2 Sources: Notes: Data is as of 30 September 2023. Fundraising timelines stretching out The evidence of a more challenging fundraising environment is also visible elsewhere. One clear example is in looking at the average time taken between 昀椀rst and 昀椀nal fund closes, as well as the average percentage of target fund size achieved by fund managers at 昀椀nal close. Since 2021, there has been clear evidence of fundraising timelines elongating signi昀椀cantly between 昀椀rst and 昀椀nal closes. In fact, between 2020 and 2022, this number has increased by more than 50% from an average of eight months to more than a year. Meanwhile, after rising consistently for almost a decade, the average share of target size achieved at 昀椀nal close by fund managers declined for the 昀椀rst time in 2022, a trend that will likely also have been continued in 2023 once the updated numbers are disclosed. 203 | Fundraising
 State of European Tech | 2023 Page 202 Page 204