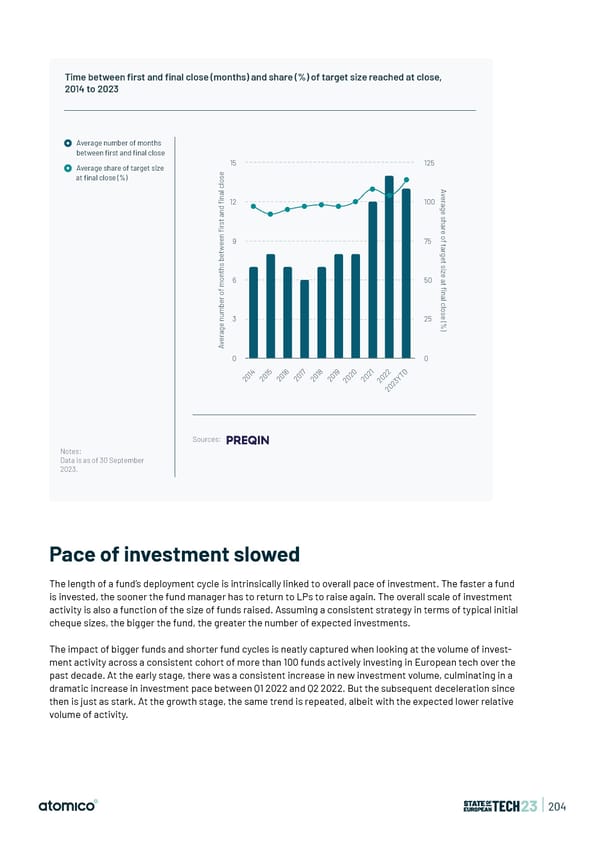
Time between first and final close (months) and share (%) of target size reached at close, 2014 to 2023 Average number of months between first and final close Average share of target size 15 125 e at final close (%) s o l c A l v a e n r fi 12 100 a g d e n a s h t a s r r fi e n o e f 9 75 e t a w r t g e e b t s s h i t z n e o 6 50 a t m fi f n o a r l e c b l o m s u e n 3 25 ( % e ) g a r e v A 0 0 4 5 6 7 8 9 0 1 2 D 1 1 1 1 1 1 2 2 2 T 0 0 0 0 0 0 0 0 0 Y 2 2 2 2 2 2 2 2 2 3 2 0 2 Sources: Notes: Data is as of 30 September 2023. Pace of investment slowed The length of a fund’s deployment cycle is intrinsically linked to overall pace of investment. The faster a fund is invested, the sooner the fund manager has to return to LPs to raise again. The overall scale of investment activity is also a function of the size of funds raised. Assuming a consistent strategy in terms of typical initial cheque sizes, the bigger the fund, the greater the number of expected investments. The impact of bigger funds and shorter fund cycles is neatly captured when looking at the volume of invest- ment activity across a consistent cohort of more than 100 funds actively investing in European tech over the past decade. At the early stage, there was a consistent increase in new investment volume, culminating in a dramatic increase in investment pace between Q1 2022 and Q2 2022. But the subsequent deceleration since then is just as stark. At the growth stage, the same trend is repeated, albeit with the expected lower relative volume of activity. | 204
 State of European Tech | 2023 Page 203 Page 205