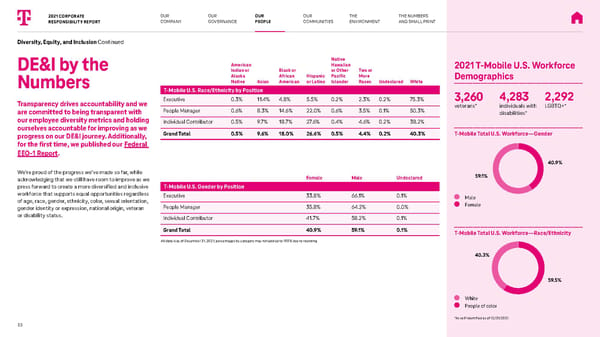
OUR COMPANY OUR GOVER NANCE OUR PEOPLE O UR COMMUN ITIES THE ENVIRON MENT THE NUMBERS AND S MALL PRINT DE&I by the Numbers Transparency drives accountability and we are committed to being transparent with our employee diversity metrics and holding ourselves accountable for improving as we progress on our DE&I journey. Additionally, for the first time, we published our Federal EEO-1 Report . We’re proud of the progress we’ve made so far, while acknowledging that we still have room to improve as we press forward to create a more diversified and inclusive workforce that supports equal opportunities regardless of age, race, gender, ethnicity, color, sexual orientation, gender identity or expression, national origin, veteran or disability status. American Indian or Alaska Native Asian Black or Afric an American Hispanic or Lat ino Native Hawai ian or Other Pacific Islander Two or More Rac es Undeclared White T-Mobile U.S. Race/Ethnicity by Position Executive 0.3% 11.4% 4.8% 5.5% 0.2% 2.3% 0.2% 75.3% People Manager 0.6% 8.3% 14.6% 22.0% 0.6% 3.5% 0.1% 50.3% Individual Contributor 0.5% 9. 7 % 18.7% 2 7. 6% 0.4% 4.6% 0.2% 38.2% Grand Total 0.5% 9. 6% 18.0% 26. 6 % 0.5 % 4.4% 0.2% 40.3% Female Male Undeclared T-Mobile U.S. Gender by Position Executive 33.8% 6 6 .1% 0.1% People Manager 35.8% 64.2% 0.0% Individual Contributor 41.7% 58.2% 0.1% Grand Total 40.9% 5 9.1 % 0.1% All data is as of December 31, 2021; percentages by category may not add up to 100% due to rounding. 2021 T-Mobile U.S. Workforce Demographics 3,26 0 veterans * 4,28 3 individuals with disabilities * 2,292 LGBTQ+* T-Mobile Total U.S. Workforce—Gender 40.9% 5 9.1 % Male Female T-Mobile Total U.S. Workforce—Race/Ethnicity Diversity, Equity, and Inclusion Continued 5 9. 5 % 40.3% 2021 CORPORATE RESPONSIBILITY REPORT 33 White People of color *As self-identified as of 12/31/2021.
 T-Mobile Corporate Responsibility Report Page 32 Page 34