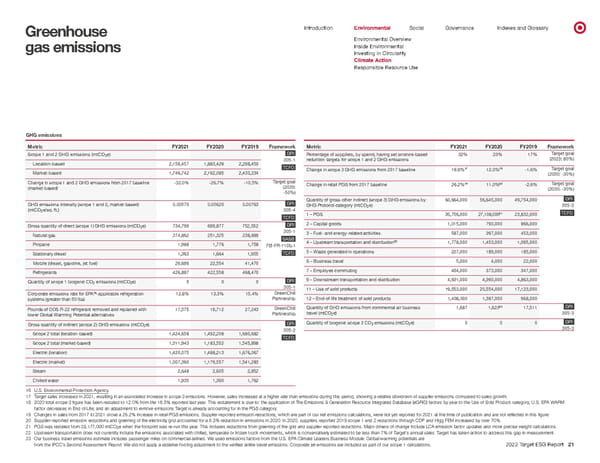
0 - - - - - - - - - - - - Introduction Environmental Social Governance Indexes and Glossary Greenhouse Environmental Overview Inside Environmental gas emissions Investing in Circularity Climate Action Responsible Resource Use GHG emissions Metric FY2021 FY2020 FY2019 Framework Metric FY2021 FY2020 FY2019 Framework Scope 1 and 2 GHG emissions (mtCO 2 e) Location-based Market-based 2,159,457 1,746,742 1,883,429 2,192,085 2,298,450 2,433,234 GRI 305-1 TCFD Percentage of suppliers, by spend, having set science-based r eduction targets for scope 1 and 2 GHG emissions Change in scope 3 GHG emissions from 2017 baseline 32% 19.9% 17 23% 12.0% 18 17% -1.6% Target goal (2023: 80%) Target goal (2030: -30%) Change in scope 1 and 2 GHG emissions from 2017 baseline (mark et-based) -32.0% -26.7% -10.5% Target goal (2030: -50%) Change in retail PGS from 2017 baseline 26.2% 19 11.0% 20 -2.6% Target goal (2030: -30%) GHG emissions intensity (scope 1 and 2, market-based) 0.00570 0.00620 0.00763 GRI Quantity of gross other indirect (scope 3) GHG emissions by GHG P rotocol category (mtCO 2 e) 60,664,000 56,645,000 49,754,000 GRI 305-3 (mtCO 2 e/sq. ft.) 305-4 TCFD 1 – PGS 30,756,000 27,108,000 21 23,832,000 TCFD Gross quantity of direct (scope 1) GHG emissions (mtCO 2 e) 734,799 699,877 752,552 GRI 2 – Capital goods 1,015,000 790,000 866,000 Natural gas Propane 274,862 1,988 251,325 1,776 238,899 1,758 305-1 SASB FB-FR-110b.1 3 – Fuel- and energy-related activities 4 – Upstream transportation and distribution 22 587,000 1,778,000 397,000 1,453,000 453,000 1,095,000 Stationary diesel 1,363 1,664 1,955 TCFD 5 – Waste generated in operations 227,000 189,000 185,000 Mobile (diesel, gasoline, jet fuel) 29,699 22,554 41,470 6 – Business travel 5,000 4,000 22,000 Refrigerants 426,887 422,558 468,470 7 – Employee commuting 404,000 373,000 347,000 Quantity of scope 1 biogenic CO 2 emissions (mtCO 2 e) 0 0 0 GRI 9 – Downstream transportation and distribution 4,931,000 4,390,000 4,863,000 Corporate emissions rate for EPA 16 -applicable refrigeration systems (greater than 50 lbs) 12.8% 13.3% 15.4% 305-1 GreenChill P artnership 11 – Use of sold products 12 – End-of-life treatment of sold products 19,553,000 1,408,000 20,554,000 1,387,000 17,123,000 968,000 Pounds of ODS R-22 refrigerant removed and replaced with lower Global W arming Potential alternatives 17,575 19,712 27,243 GreenChill P artnership Quantity of GHG emissions from commercial air business tr avel (mtCO 2 e) 1,687 1,623 23 17,511 GRI 305-3 Gross quantity of indirect (scope 2) GHG emissions (mtCO 2 e) GRI 305-2 Quantity of biogenic scope 3 CO 2 emissions (mtCO 2 e) 0 0 0 GRI 305-3 Scope 2 total (location-based) 1,424,658 1,492,208 1,680,682 TCFD Scope 2 total (market-based) 1,011,943 1,183,552 1,545,898 Electric (location) 1,420,075 1,488,213 1,676,067 Electric (market) 1,007,360 1,179,557 1,541,283 Steam 2,648 2,605 2,852 Chilled water 1,935 1,390 1,762 16 U.S. Environmental Protection Agency. 17 Target sales increased in 2021, resulting in an associated increase in scope 3 emissions. However, sales increased at a higher rate than emissions during this period, showing a relative slowdown of supplier emissions compared to sales growth. 18 2020 total scope 3 figure has been restated to 12.0% from the 16.5% reported last year. This restatement is due to: the application of The Emissions & Generation Resource Integrated Database (eGRID) factors by year to the Use of Sold Product category; U.S. EPA WARM fact or decreases in End of Life; and an adjustment to remove emissions Target is already accounting for in the PGS category. 19 Changes in sales from 2017 to 2021 drove a 26.2% increase in retail PGS emissions. Supplier-reported emission reductions, which are part of our net emissions calculations, were not yet reported for 2021 at the time of publication and are not reflected in this figure. 20 Supplier-reported emission reductions and greening of the electricity grid accounted for a 5.3% reduction in emissions in 2020. In 2020, suppliers reported 2019 scope 1 and 2 reductions through CDP and Higg FEM increased by over 70%. 21 PGS was restated from 29,177,000 mtCO 2 e when the footprint was re-run this year. This includes reductions from greening of the grid and supplier reported reductions. Major drivers of change include LCA emission factor updates and more precise weight calculations. 22 Upstream transportation does not currently include the emissions associated with chilled, temperate or frozen truck movements, which is conservatively estimated to be less than 7% of Target’s annual sales. Target has taken action to address this gap in measurement. 23 Our business travel emissions estimate includes passenger miles on commercial airlines. We used emissions factors from the U.S. EPA Climate Leaders Business Module. Global warming potentials are fr om the IPCC’s Second Assessment Report. We did not apply a radiative forcing adjustment to the verified airline travel emissions. Corporate jet emissions are included as part of our scope 1 calculations. 2022 Target ESG Report 21
 Target ESG Report Page 20 Page 22