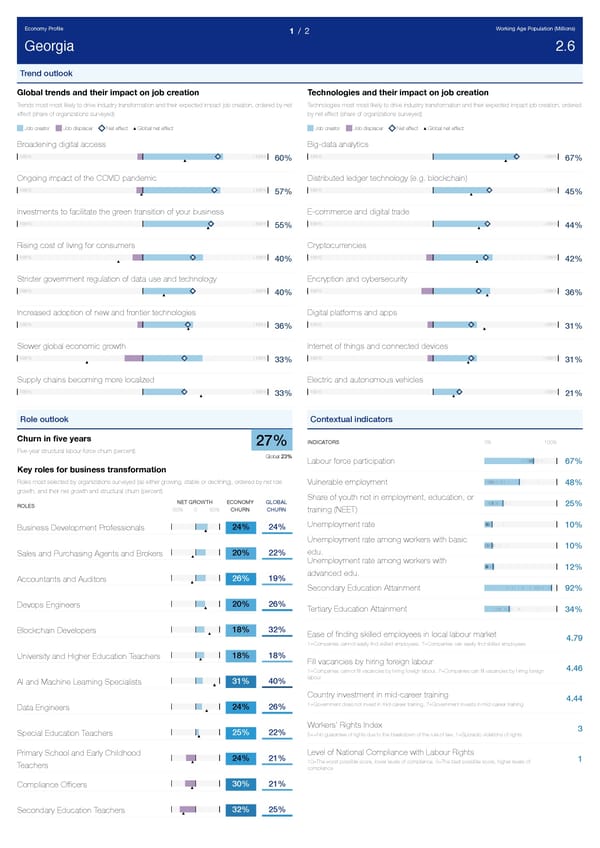
Economy Profile Working Age Population (Millions) 1 / 2 Georgia 2.6 Trend outlook Global trends and their impact on job creation Technologies and their impact on job creation Trends most most likely to drive industry transformation and their expected impact job creation, ordered by net Technologies most most likely to drive industry transformation and their expected impact job creation, ordered effect (share of organizations surveyed) by net effect (share of organizations surveyed) Job creator Job displacer Net effect Global net effect Job creator Job displacer Net effect Global net effect Broadening digital access Big-data analytics -100% +100% -100% +100% 60% 67% Ongoing impact of the COVID pandemic Distributed ledger technology (e.g. blockchain) -100% +100% -100% +100% 57% 45% Investments to facilitate the green transition of your business E-commerce and digital trade -100% +100% -100% +100% 55% 44% Rising cost of living for consumers Cryptocurrencies -100% +100% -100% +100% 40% 42% Stricter government regulation of data use and technology Encryption and cybersecurity -100% +100% -100% +100% 40% 36% Increased adoption of new and frontier technologies Digital platforms and apps -100% +100% -100% +100% 36% 31% Slower global economic growth Internet of things and connected devices -100% +100% -100% +100% 33% 31% Supply chains becoming more localized Electric and autonomous vehicles -100% +100% -100% +100% 33% 21% Role outlook Contextual indicators Churn in five years INDICATORS 0% 100% 27% Five-year structural labour-force churn (percent) Global 23% Labour force participation 67% Key roles for business transformation Roles most selected by organizations surveyed (as either growing, stable or declining), ordered by net role Vulnerable employment 48% growth, and their net growth and structural churn (percent) Share of youth not in employment, education, or NET GROWTH ECONOMY GLOBAL 25% ROLES -50% 0 50% CHURN CHURN training (NEET) Unemployment rate 10% 24% 24% Business Development Professionals Unemployment rate among workers with basic 10% edu. 20% 22% Sales and Purchasing Agents and Brokers Unemployment rate among workers with 12% advanced edu. 26% 19% Accountants and Auditors Secondary Education Attainment 92% 20% 26% Devops Engineers Tertiary Education Attainment 34% 18% 32% Blockchain Developers Ease of finding skilled employees in local labour market 4.79 1=Companies cannot easily find skilled employees, 7=Companies can easily find skilled employees 18% 18% University and Higher Education Teachers Fill vacancies by hiring foreign labour 4.46 1=Companies cannot fill vacancies by hiring foreign labour, 7=Companies can fill vacancies by hiring foreign labour 31% 40% AI and Machine Learning Specialists Country investment in mid-career training 4.44 1=Government does not invest in mid-career training, 7=Government invests in mid-career training 24% 26% Data Engineers Workers' Rights Index 3 25% 22% Special Education Teachers 5+=No guarantee of rights due to the breakdown of the rule of law, 1=Sporadic violations of rights Level of National Compliance with Labour Rights Primary School and Early Childhood 24% 21% 1 10=The worst possible score, lower levels of compliance, 0=The best possible score, higher levels of Teachers compliance 30% 21% Compliance Officers 32% 25% Secondary Education Teachers
 The Future of Jobs Report 2023 Page 119 Page 121