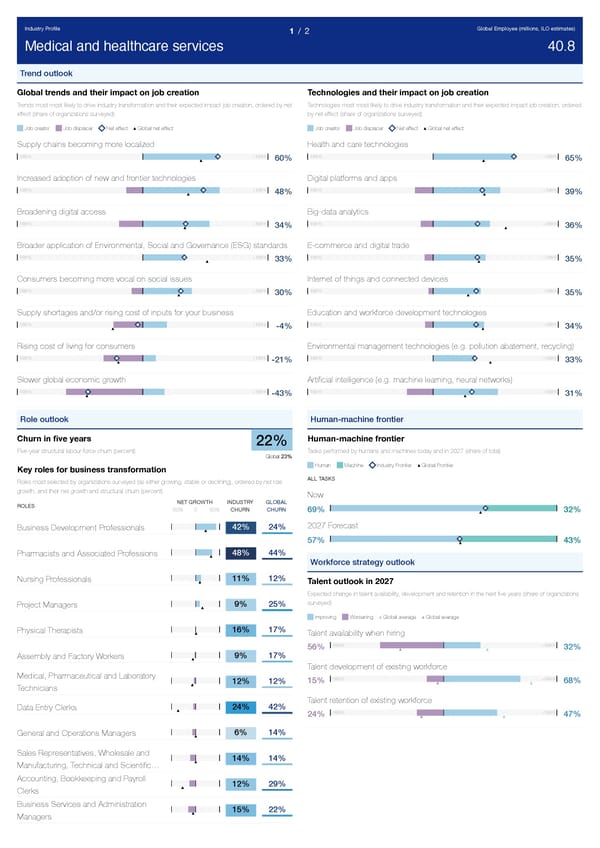
Industry Profile Global Employee (millions, ILO estimates) 1 / 2 Medical and healthcare services 40.8 Trend outlook Global trends and their impact on job creation Technologies and their impact on job creation Trends most most likely to drive industry transformation and their expected impact job creation, ordered by net Technologies most most likely to drive industry transformation and their expected impact job creation, ordered effect (share of organizations surveyed) by net effect (share of organizations surveyed) Job creator Job displacer Net effect Global net effect Job creator Job displacer Net effect Global net effect Supply chains becoming more localized Health and care technologies -100% +100% -100% +100% 60% 65% Increased adoption of new and frontier technologies Digital platforms and apps -100% +100% -100% +100% 48% 39% Broadening digital access Big-data analytics -100% +100% -100% +100% 34% 36% Broader application of Environmental, Social and Governance (ESG) standards E-commerce and digital trade -100% +100% -100% +100% 33% 35% Consumers becoming more vocal on social issues Internet of things and connected devices -100% +100% -100% +100% 30% 35% Supply shortages and/or rising cost of inputs for your business Education and workforce development technologies -100% +100% -100% +100% -4% 34% Rising cost of living for consumers Environmental management technologies (e.g. pollution abatement, recycling) -100% +100% -100% +100% -21% 33% Slower global economic growth Artificial intelligence (e.g. machine learning, neural networks) -100% +100% -100% +100% -43% 31% Role outlook Human-machine frontier Churn in five years Human-machine frontier 22% Five-year structural labour-force churn (percent) Tasks performed by humans and machines today and in 2027 (share of total) Global 23% Human Machine Industry Frontier Global Frontier Key roles for business transformation ALL TASKS Roles most selected by organizations surveyed (as either growing, stable or declining), ordered by net role growth, and their net growth and structural churn (percent) Now NET GROWTH INDUSTRY GLOBAL ROLES -50% 0 50% CHURN CHURN 69% 32% 2027 Forecast 42% 24% Business Development Professionals 57% 43% 48% 44% Pharmacists and Associated Professions Workforce strategy outlook 11% 12% Nursing Professionals Talent outlook in 2027 Expected change in talent availability, development and retention in the next five years (share of organizations surveyed) 9% 25% Project Managers Improving Worsening Global average Global average 16% 17% Physical Therapists Talent availability when hiring -100% +100% 56% 32% 9% 17% Assembly and Factory Workers Talent development of existing workforce Medical, Pharmaceutical and Laboratory -100% +100% 15% 68% 12% 12% Technicians Talent retention of existing workforce 24% 42% Data Entry Clerks -100% +100% 24% 47% 6% 14% General and Operations Managers Sales Representatives, Wholesale and 14% 14% … Manufacturing, Technical and Scientific Accounting, Bookkeeping and Payroll 12% 29% Clerks Business Services and Administration 15% 22% Managers
 The Future of Jobs Report 2023 Page 218 Page 220